
Figure 3.
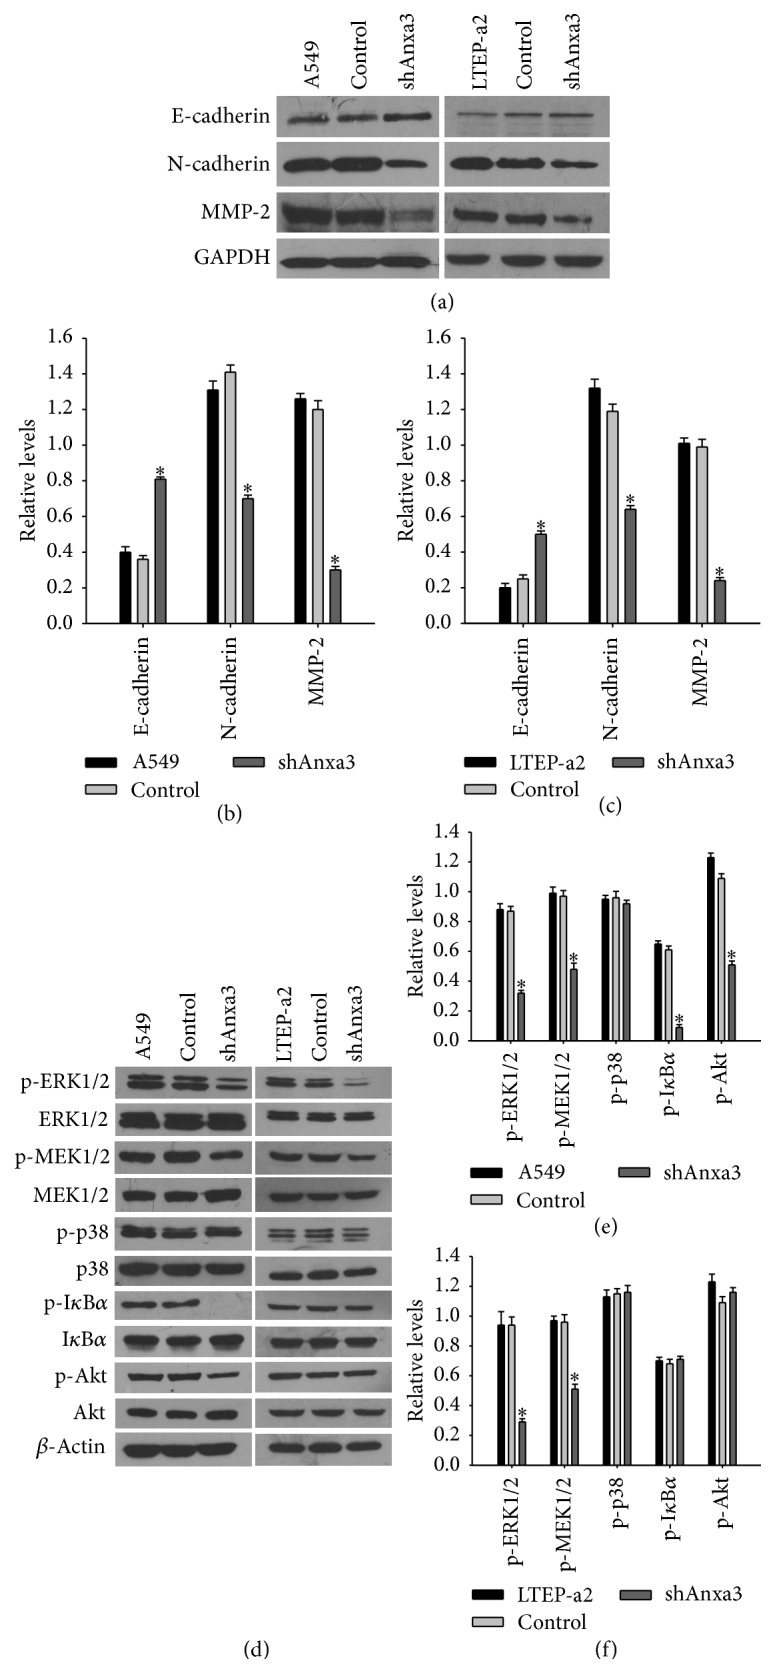
Knockdown of Anxa3 expression affected the expression of some effector molecules and some signaling molecules. (a) Western blot analysis of the expression of MMP-2, N-cadherin, and E-cadherin. (b, c) Histograms of the relative expressions of the effector molecules. ∗ indicates p < 0.05. (d) Western blot analysis of the expression of some cancer-associated signaling molecules in A549 and LTEP-a2 cells and their corresponding stably transfected cell lines. (e, f) Histograms of the relative expressions of the signaling molecules. ∗ indicates p < 0.05.