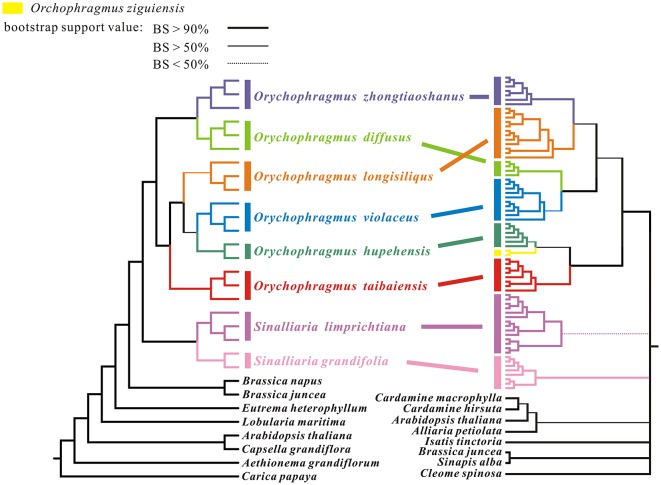
Figure 3.
Maximum likelihood tree based on analyses of whole chloroplast genome sequences for 17 Orychophragmus individuals and of unique nrITS ribotype sequences. The left tree is topologically congruent with the Bayesian consensus tree. Statistical support from maximum likelihood with different values were shown as different line forms. The different taxa of Orychophragmus and Sinalliaria are marked by different colors. Individual number is given after original species name. The right-hand tree was cited from our previous study (Hu H. et al., 2015).

