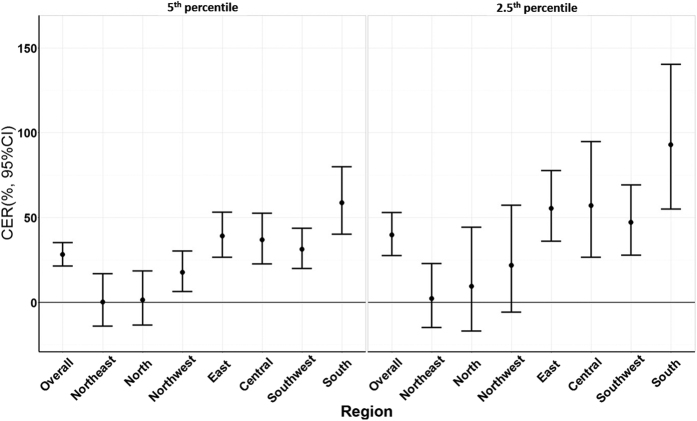
Figure 2. Summary CER (95% CI) of different intensity of cold spells on total non-accidental mortality during lag 0–27 days in different regions of China, 2006–2011.
CER: Cumulative excess risk of mortality for cold spell exposure during lag 0–27 days. In the left plot, a cold spell was defined as a weather fluctuation if the mean daily temperature fell below the 5th percentile of the study period (cold season in 2006–2011) in a specific community for at least 2 consecutive days. In the right plot, a cold spell was defined as a weather fluctuation if the mean daily temperature fell below the 2.5th percentile of the study period (cold season in 2006–2011) in a specific community for at least 2 consecutive days.

