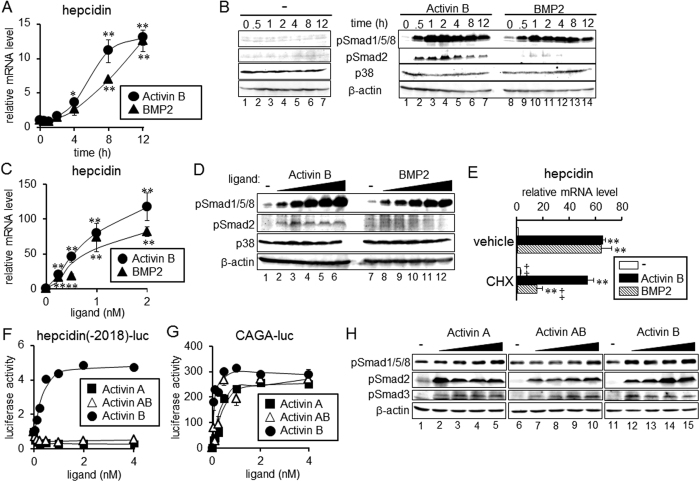
Figure 2. Induction of hepcidin by activin B in rat primary hepatocytes.
(A–D) Rat primary hepatocytes were cultured in 0.2% FBS for 4 h, followed by treatment with activin B (2 nM) or BMP2 (4 nM) for the indicated time (A,B) or by treatment with various concentrations of activin B, i.e., 0, 0.125, 0.25, 0.5, 1 or 2 nM, or BMP2, i.e., 0, 0.25, 0.5, 1, 2 or 4 nM, for 1 h (D) or 8 h (C). (A,C) Hepcidin expression was examined by RT-qPCR analysis. Mean ± SE (n = 3). * and **P < 0.05 and P < 0.01, respectively, vs. cells treated without activin B or BMP2. (B,D) Phosphorylation of Smad1/5/8 and Smad2 as well as p38 and β-actin as the loading controls was examined by Western blot analysis. (E) Effect of cycloheximide was examined. Rat primary hepatocytes were stimulated with activin B (2 nM) or BMP2 (4 nM) in the presence or absence of cycloheximide (1 μg/mL) for 8 h. Hepcidin expression was examined by RT-qPCR analysis. Mean ± SE (n = 3). **P < 0.01 vs. cells treated with the respective inhibitor (vehicle or CHX) but not with activin B or BMP2. ‡P < 0.01 vs. cells treated with the respective TGF-β family ligand (none, activin B or BMP2) but not with CHX. (F,G) HepG2 cells were transfected with the indicated reporters and CMV-βGal. At 4 h post-transfection, cells were treated with or without activin A, activin AB or activin B for 12 h. Luciferase activity normalized to β-galactosidase activity was calculated. Mean ± SE (n = 3). (H) HepG2 cells were treated with increasing concentrations of activin A, activin AB or activin B, i.e., 0, 0.5, 1, 2 or 4 nM, for 1 h. Phosphorylation of Smad1/5/8, Smad2 and Smad3 as well as the loading control β-actin was examined by Western blot analysis. The cropped images of Western blot analysis are shown because of space liminations; images of the full-length blot are Supplementary Fig. S10.

