
Figure 2. Illustration of sector-based clustering in a three-dimensional scatter plot.
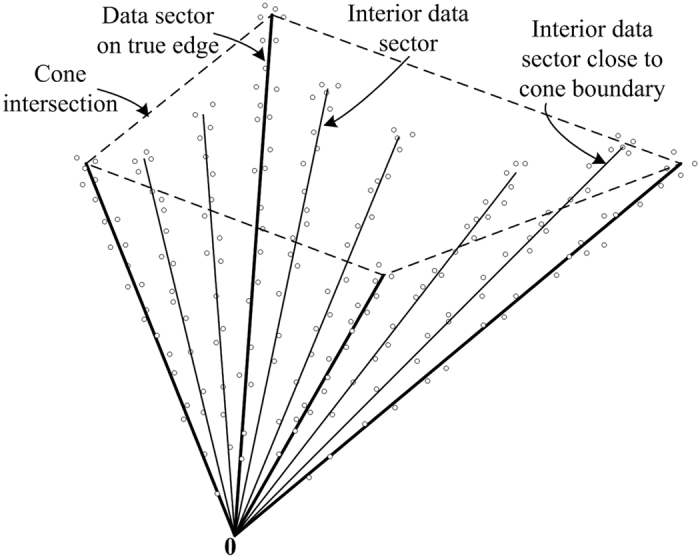
Four sources (K = 4) are mixed to form three mixtures (M = 3). Small circles are data points. After clustering, each data sector is represented by a sector central ray (solid lines). Four data sectors are on (or close to) the true edges of cone C{X}, with their sector central rays indicated by bold lines. The quadrilateral formed by the dashed lines indicate the intersection of the cone.