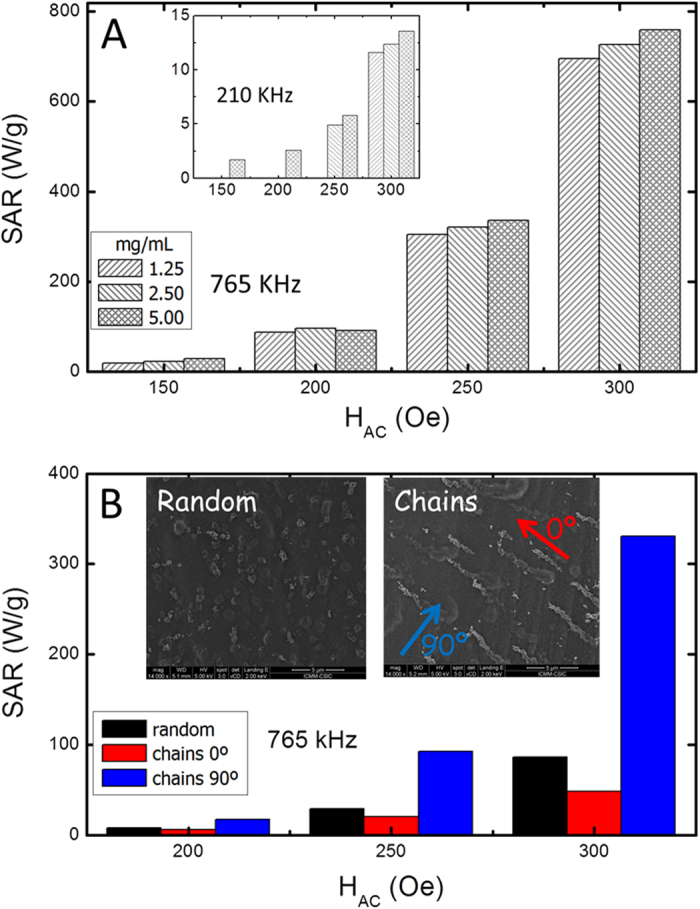
Figure 2.

(A) SAR values of particles dispersions in water as a function of the field amplitude and for different concentrations (1.25, 2.50, and 5.00 mg/mL), measured at 765 kHz; the inset shows the corresponding data measured at 210 kHz. (B) SAR values as a function of the field amplitude, for a randomly distributed system and for a chain-like assembly in agarose matrix (3% wt); for the latter the SAR has been measured parallel (φ = 0°) and perpendicular (φ = 90°) to the chains. The insets correspond to SEM images.
