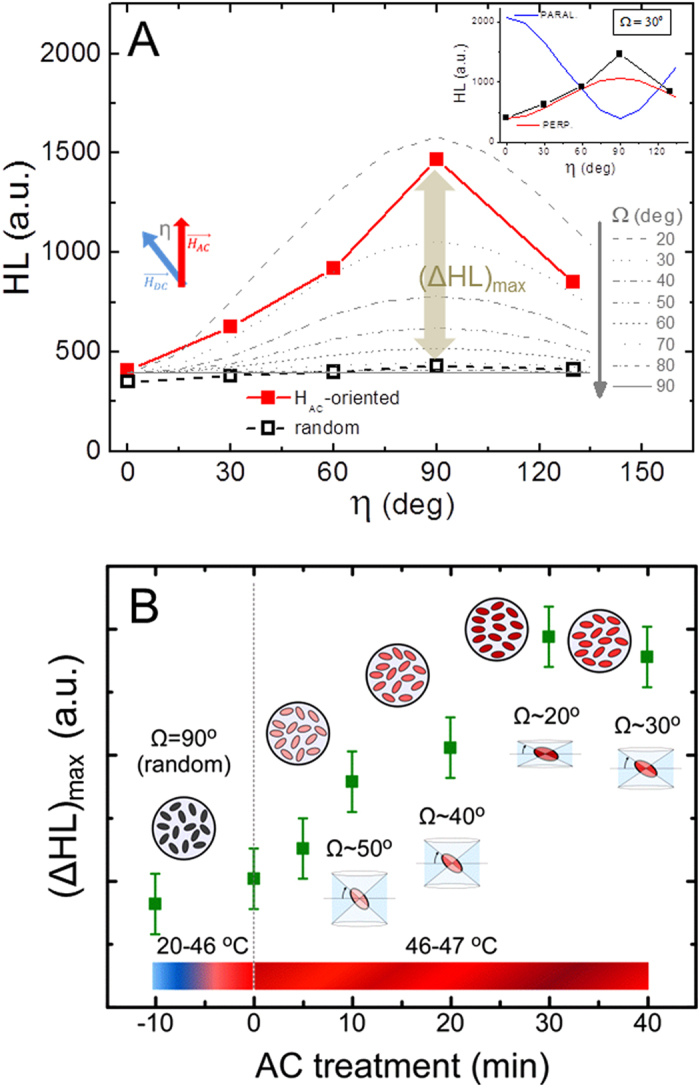
Figure 4.

(A) Shows the experimentally evaluated HL values (full squares) as a function of the relative angle between AC field treatment, and DC measurement directions. The empty squares correspond to the non-oriented sample. The grey lines are the simulated angular-dependent cases for different Ω values, for the perpendicular-reorientation case (Fig. 3E). The inset shows the comparison with the parallel case, which clearly is not the experimental observation). (B) evolution of the HL losses along the perpendicular direction as a function of the duration of the AC treatment, which results in a different collinearity (as indicated by the corresponding Ω values).
