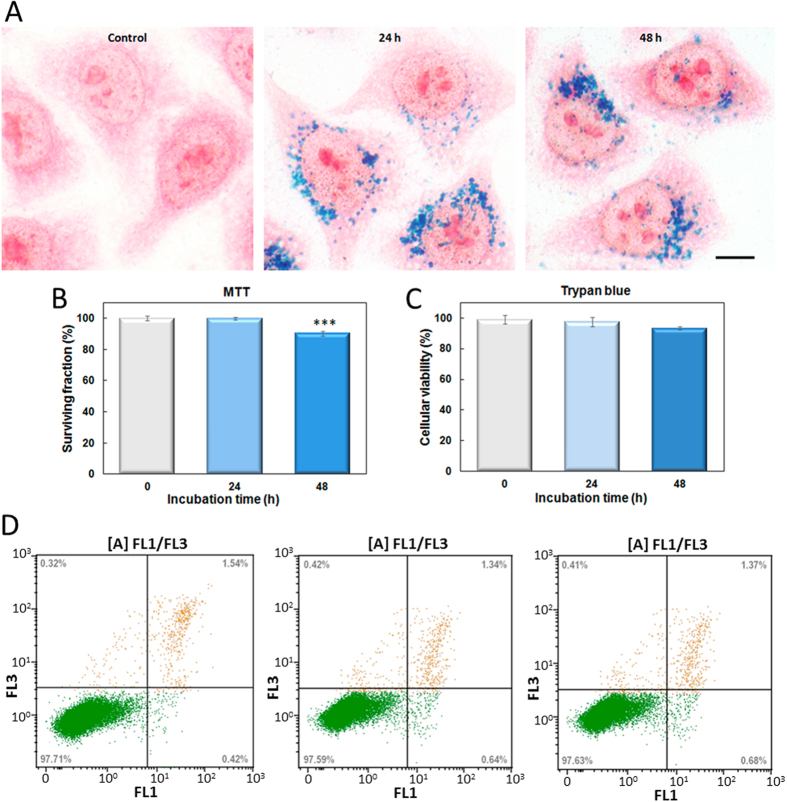
Figure 5. Cellular studies.
(A) Prussian blue staining in control HeLa cells (a) or incubated with the nanorods at 0.1 mg/ml for 24 or 48 h. Scale bar = 5 μm. (B) MTT cell viability assay carried out after 24 h after incubation, show that the nanorods do not induced cytotoxicity on HeLa cells, but 48 h is at the limit of toxicity. Data correspond to mean ± SD values from at least six different experiments. Statistically significant differences are labeled as “***” when P < 0.001, for comparisons between groups using one-way ANOVA with pairwise comparisons between means (all groups versus control). (C) Trypan blue assay demonstrated no significant increase in dead cells number after both incubation times. (D) Representative flow cytometry histograms of Annexin V-FITC (FL1) in combination with PI (FL3) staining in control cells (a) or incubated with the nanorods for 24 h (b) or 48 h (c). Numbers in each quadrant indicate the percentage of cells. Similar percentages of viable, apoptotic (early and late) and necrotic cells were obtained on samples non-incubated (control) and after nanorods incubation.

