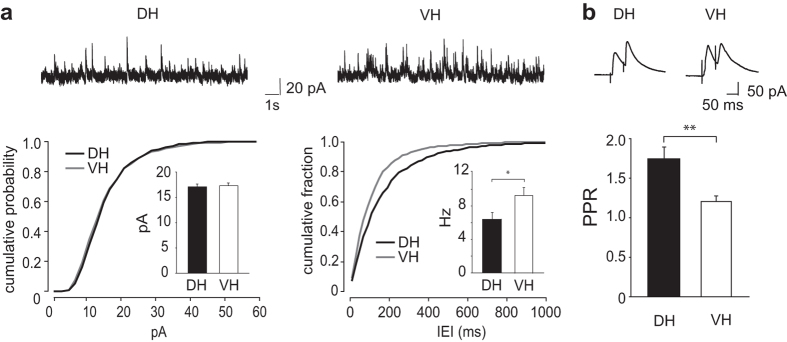
Figure 5. Differences in release from inhibitory synapses in slices of DH and VH.
Whole cell records from CA1 pyramidal cells. (a) Histograms of mean mIPSC amplitude (left) and frequency (right) in DH and VH. Above: representative patch-clamp recordings of mIPSCs in CA1 pyramidal neurons in DH and VH. Bottom: cumulative probability histogram of mIPSCs amplitude (left) and IEI (right) from DH (black line) and VH (gray line) cells. Mean amplitude for mIPSCs: DH, 16.3 ± 0.7 pA (n = 10/8/8, Total number on events, 2010); VH, 16.6 ± 0.6 pA (n = 13/10/10, Total number on events, 2610). Mean frequency for mIPSCs: DH: 6.4 ± 0.8 Hz, (n = 10/8/8); VH: 9.3 ± 0.9 Hz (n = 13/10/10). Note the shift toward the left in IEI curves indicating an increase in mIPSCs frequency of VH cells. (b) Mean PPR for evoked IPSCs in CA1 pyramidal cells of DH and VH. Mean PPR: DH, 1.75 ± 0.15, n = 16/10/10; VH, 1.19 ± 0.07, n = 16/11/11). Above: evoked IPSCs showing differences in PPR at inhibitory synapses of DH and VH. Data shown as mean ± S.E.M. *Indicates p < 0.05 and **indicates p < 0.01. Traces are an average of the ten consecutive slices.

