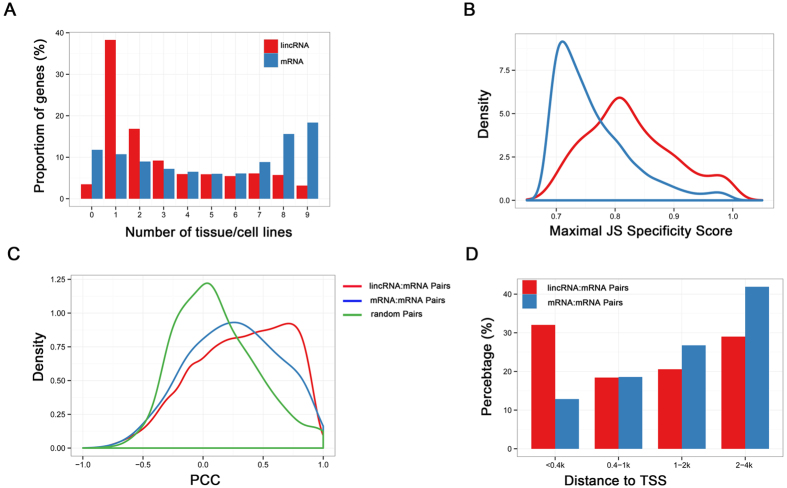
Figure 3. Characteristics of pig lincRNAs expression.
(A) Distribution of the number of tissues in which lincRNA and protein-coding transcripts are detected (FPKM >0.1). (B) Distribution of maximal tissue specificity scores in various categories. lincRNA (Red); mRNA (Blue) (C) Distribution of correlation of neighbouring (gene body distance <10 kb). (D) Distribution of distance between 2 TSS of neighbour gene pairs. lincRNA: Coding gene pairs (Red); Coding gene pairs (Blue); Random gene pairs (Green).

