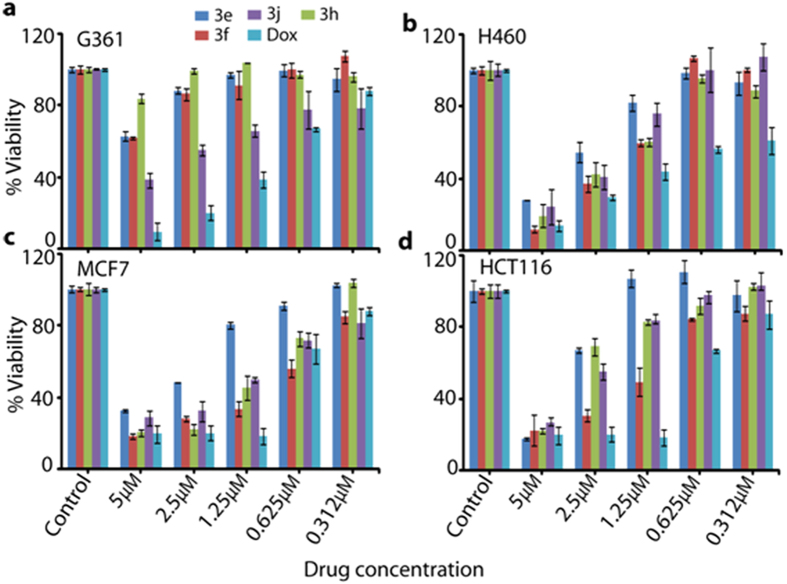
Figure 2.
Change in cell viability upon exposure to different concentrations of compounds 3e-3f in different cell lines: (a) G361; (b) H460 (c) MCF7 and (d) HCT116. In each experiment a negative control (no drug treatment) and a standard anticancer drug, Doxorubicin was used. All values are expressed as triplicate averages ± SD.

