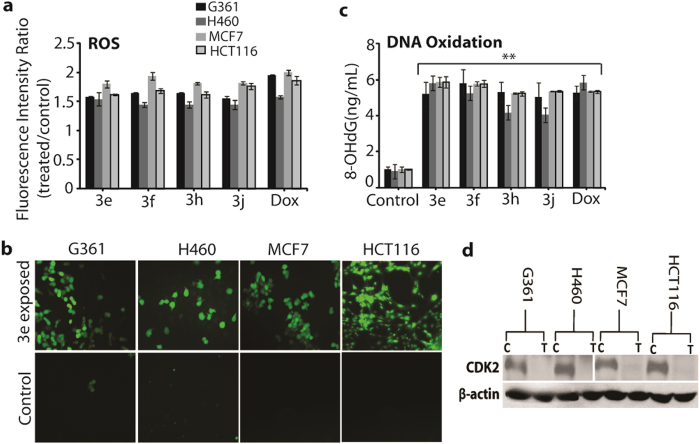
Figure 4. Changes in intracellular ROS and DNA oxidation.
(a) Level of intracellular ROS in all cancer cells after exposure tocompounds 3e, 3f, 3h, 3j and Doxorubicin. All values are expressed as the fluorescence intensity ratio between compound and control. All values are expressed as triplicate averages ± SD. (b) Qualitative analysis of intracellular ROS level after exposure to compound 3e in all cancer cells from fluorescence microscopy using the fluorescent probe H2DCFDA. (c) Amount of 8-OHdG production upon DNA oxidation upon exposure to compounds 3e, 3f, 3h, 3j and Doxorubicin. (d) Western blot analysis of CDK2 expression after exposure to compound 3e in all cancer cells. All values are expressed as triplicate averages ± SD. A Student t-test was performed with respect to the control (*denotes P < 0.05 and **denotes P < 0.01).

