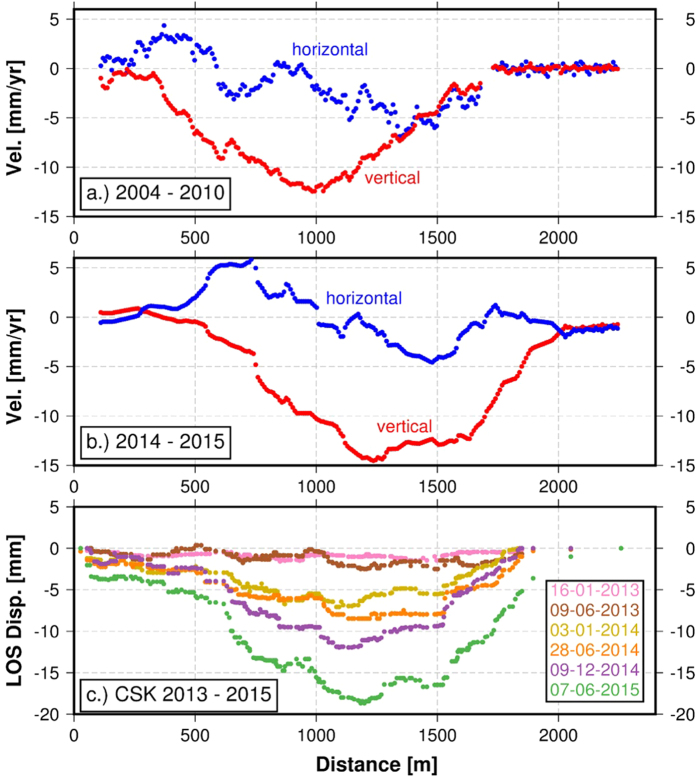
Figure 3. Subsidence profiles.
(a) Vertical and east component of surface velocities along the Mosul Dam from Envisat 2004-2010 2D deformation (b) velocity components from CSK, Sentinel-1a velocity maps obtained using data spanning the same time period (December 2014–July 2015). The results confirm that the vertical velocities greatly exceed the horizontal contribution typical of subsidence patterns. (c) CSK LOS cumulative displacement profiles.

