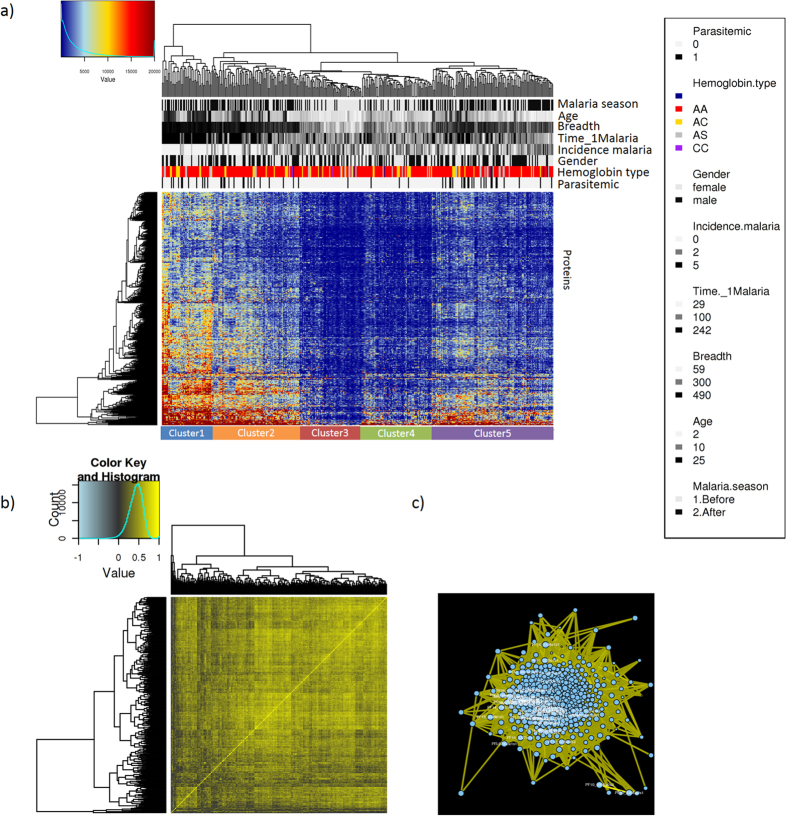
Figure 1. Antibody response to 491 seropositive malaria parasite (P. falciparum) proteins.
From each individual (n = 194), two samples were included (one before and one after the malaria season). (a) Hierarchical clustering of antibody signal intensities of 491 seropositive P. falciparum proteins. Proteins were considered seropositive for antibody response if the signal intensity was greater than the mean signal intensity of No-DNA negative controls plus 1.5 times the standard deviation (SD). Antibody response to P. falciparum proteins form five distinct clusters associated with subject age, time of the malaria season and incidence of clinical malaria. Cluster 1 represented samples collected after the malaria season from adults who were parasite positive and showed low incidence of malaria during the 8 months study period. Cluster 2 represented antibody profiles collected before the malaria season of older children, parasitemic with higher incidence of clinical malaria. Cluster 3 represented antibody profiles before the malaria season of young children, who were non parasitemic with high incidence of clinical malaria during the study period. Cluster 4 was associated with antibody profiles after the malaria season of older children who had high incidence of clinical malaria. Cluster 5 represented antibody profiles after malaria season of older children, who were parasitemic and had a low incidence of clinical malaria. (b) Heatmap of Pearson’s correlations between signal intensity of 491 seropositve proteins. (c) Network analysis of host antibody response against P. falciparum proteins. Nodes represent parasite proteins, yellow and blue edges represent positive and negative correlations, respectivley.

