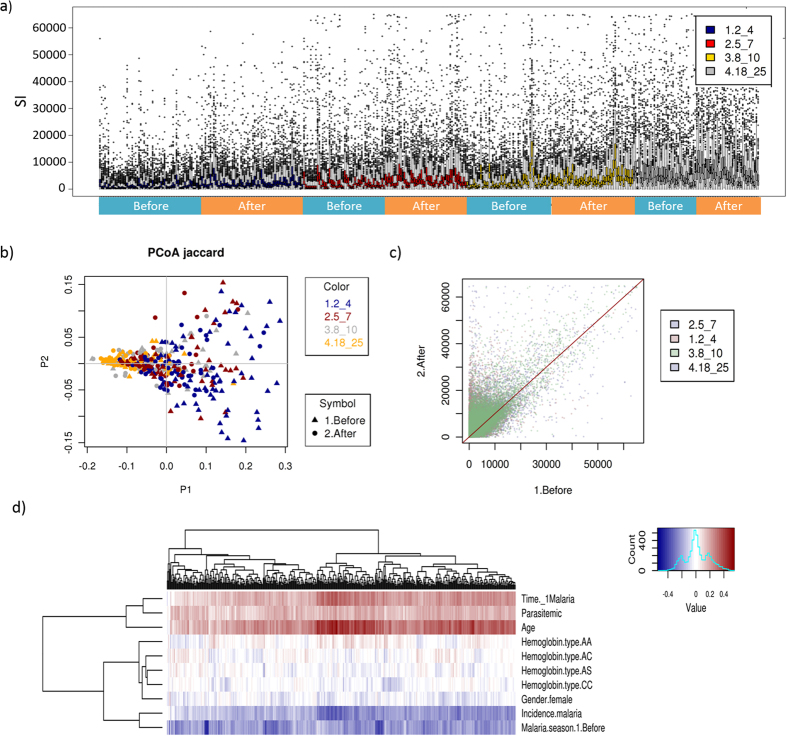
Figure 2. Antibody reactivity increased with age and from before to after the malaria season (n = 194 individuals, two samples per individual).
(a) Box plot showing the signal intensities of 491 seropositive proteins before and after the malaria season in each age group (2–4, 5–7, 8–10 and 18–25 years). (b) Principal coordinates analysis (PCoA) of antibody signal intensities (Jaccard distance). Principal coordinate 1 explained variation in the antibody reactivity associated with age, principal coordinate 2 the variation attributed to the time of the malaria season (before or after). Colors indicate age group and symbols the time of the malaria season. Individuals cluster by age and time of the malaria season. (c) Scatter plot of signal intensities of 491 seropositive proteins before and after the malaria season. Each dot represents one protein. Dots are significantly shifted towards the upper left, indicating that antibody response against Plasmodium proteins is generally stronger after the malaria season (y-axis). This shift is significant for each of the four age groups (p < 2.9 × 10−62 for all age groups). (d) Heatmap visualizing Pearson’s correlation between antibody signal intensities, age, concurrent parasitemia, gender, hemoglobin type, time during the malaria season, incidence of malaria episode and days until the first malaria episode. Positive correlations are shown in red, negative correlations in blue.

