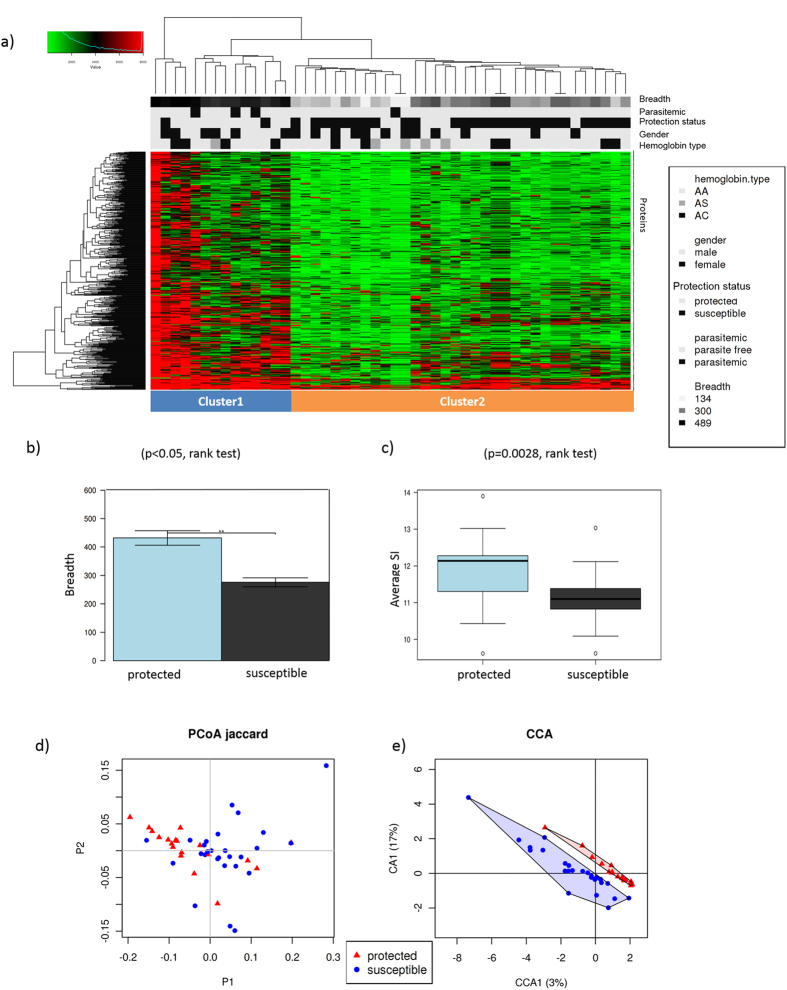
Figure 3. Plasmodium-specific antibody profiles in protected and susceptible children.
Children of 8–10 years of age (n = 48) were defined “protected” if they did not experience a clinical malaria episode during the 8-month study period (n = 19) and “susceptible” if they did experience ≥1 malaria episodes (n = 29 children). Antibody response was measured at the beginning of the 8-month study period before the malaria season. (a) Heatmap of the antibody signal intensities against 491 seropositive P. falciparum proteins for the 48 children. Antibody response to parasite proteins showed a marked difference between protected (n = 19) and susceptible (n = 29) children. Protected children (Cluster 1) had a significantly higher breadth and magnitude of antibody response and responded to a different combination of proteins compared to susceptible children (Cluster 2). Breadth of antibody responses (number of seropositive Plasmodium proteins) for each individual (b) and magnitude of antibody responses (average signal intensity of seropositive proteins) (c) in protected and susceptible children. Significance of differences in breadth and magnitude of antibody response was measured by Wilcoxon–Mann–Whitney test. (d) Principal coordinate analysis (PCoA) of antibody signal intensities before the malaria season of the 491 seropositive proteins (Jaccard distance). Children clustered by protection status (protected versus susceptible). (e) Canonical correspondence analysis (CCA) of antibody signal intensities including protection from malaria (protected/susceptible), gender, concurrent parasitemia and hemoglobin type as explanatory variables. Immunity to malaria was significantly associated with antibody response (CCA p = 0.020), while gender (CCA p = 0.332), parasitemia (CCA p = 0.162) and hemoglobin type (CCA p = 0.329) were not.

