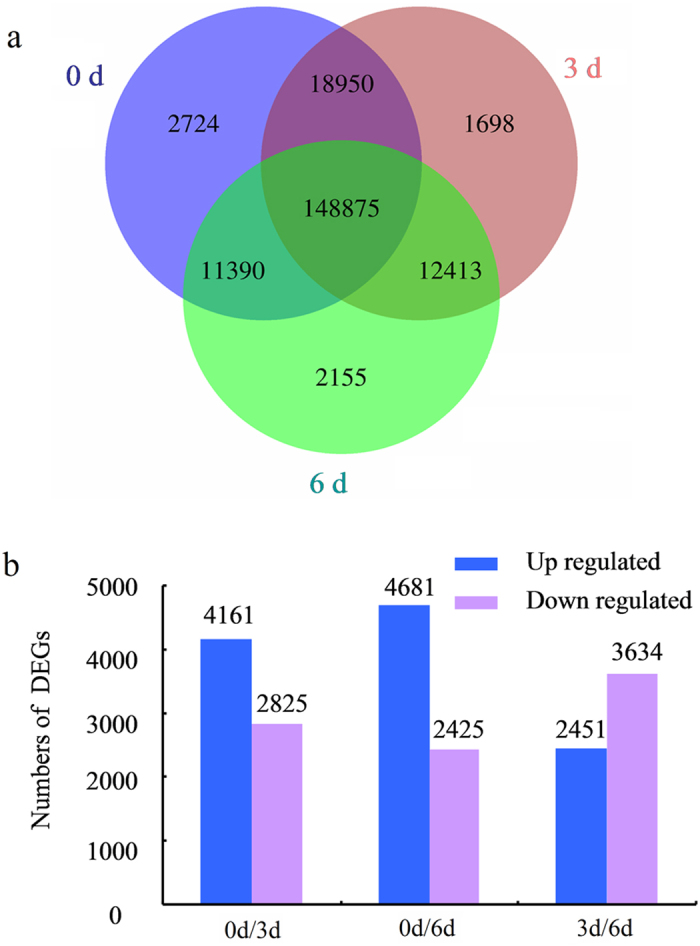
Figure 2. Analysis of global gene expression among three samples.

(a) The number of common and unique unigenes expressed among three libraries. (b) The number of significantly (P-value ≤ 0.05 and at least two-fold change) up- and down-regulated transcripts between two compared samples.
