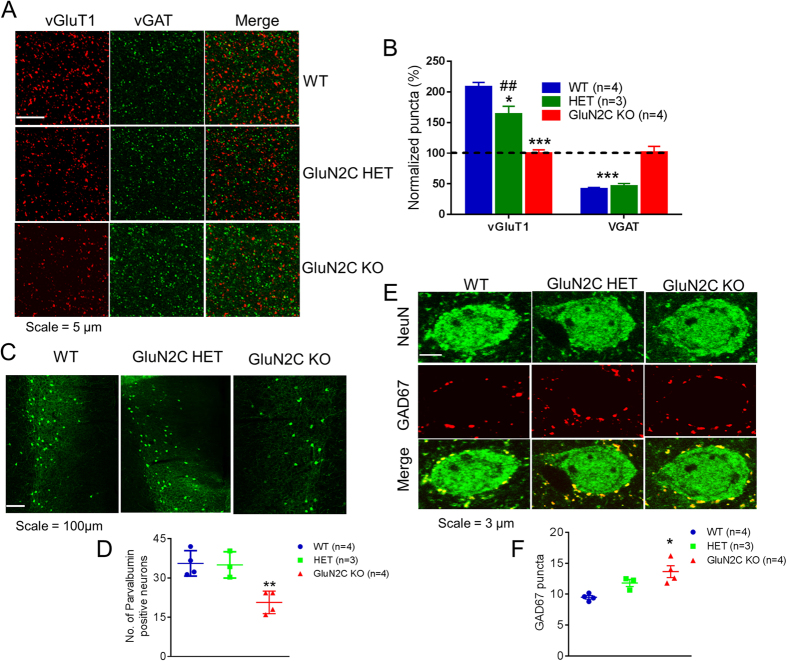
Figure 3. Excitatory-inhibitory synapses are altered in GluN2C knockout mice.
(A,B) vGluT1 and vGAT puncta in layer V mPFC of WT, GluN2C HET and GluN2C KO mice. (A) Representative images of layer V mPFC at 10X (top) and 63X (bottom) indicating vGluT1 and vGAT puncta and (B) quantitative results. GluN2C HET and KO mice had a significantly lower number of vGluT1-positive puncta relative to WT controls (n = 3–4/genotype, one-way ANOVA followed by Bonferroni’s post-hoc test, *P < 0.05, ***P < 0.001). Knockouts also showed a significantly higher number of vGAT-positive puncta relative to WT controls (n = 3–4/genotype, Bonferroni’s post-hoc test, ***P < 0.001). (C,D) The number of PV-positive cells were significantly lower in the mPFC of GluN2C KO mice at P30 (Bonferroni’s post-hoc test, n = 3–4/genotype, **P < 0.01). (C) Representative images and (D) quantitative results. (E,F) The number of perisomatic GAD67 puncta on NeuN-labelled cells in layer V of the mPFC was significantly higher in GluN2C KO mice relative to WT controls (Bonferroni’s post-hoc test, n = 3–4/genotype, *P < 0.05). (E) Representative images at 63X indicating GAD67 puncta (red) on NeuN-positive cells (green) and (F) quantitative results.

