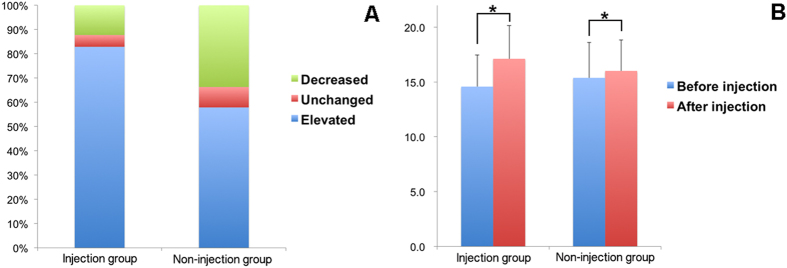
Figure 1. IOP change 30 min after each injection in the injection and non-injection groups.
(A) In the injection group, the percentages of subjects who experienced an elevation in IOP, no change in IOP, or a decrease in IOP were 83%, 5 and 12%, respectively. The results were 58%, 8 and 34%, respectively, in the non-injection group. (B) The average IOP elevation was 2.54 mmHg in the injection group and 0.64 mmHg in the non-injection group. Both elevations were statistically significant; bars represent standard deviation (*p < 0.01).

