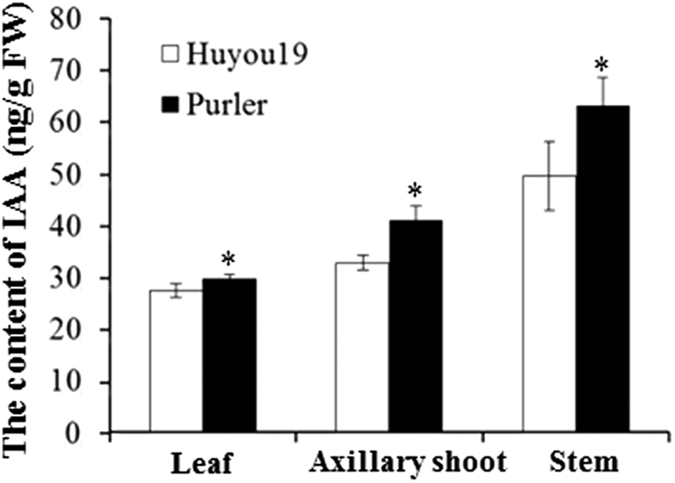
Figure 6. IAA of three tissue samples in Huyou19 and Purler.

The data represent three independent experiments. Asterisks indicate a significant difference was detected between Huyou19 and Purler in the same tissue sample at *P < 0.05.

The data represent three independent experiments. Asterisks indicate a significant difference was detected between Huyou19 and Purler in the same tissue sample at *P < 0.05.