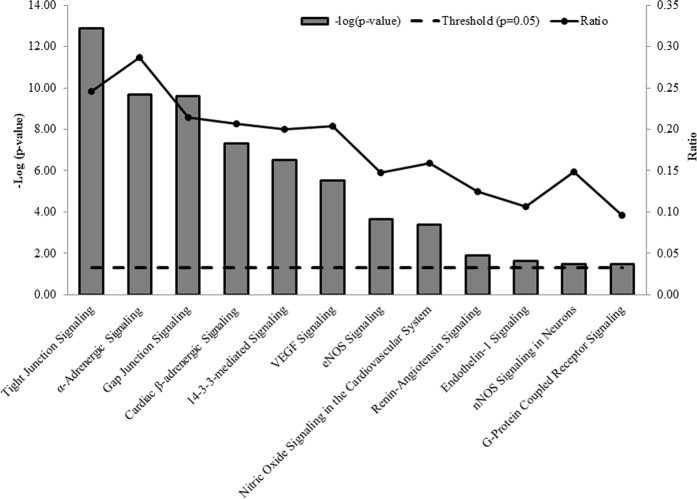
Figure 7. Canonical pathways involved in vasoactivity of the sPCA.
This bar chart shows the canonical pathways which were significantly (p < 0.001) implicated in the vasoactivity of the sPCA, analysed employing IPA. The negative of the log10 (p-value; bar chart) and ratio (number of focus molecules involved in the pathway/total number of molecules in the pathway; solid line joined by circles) are plotted on the primary and secondary Y-axes, respectively.

