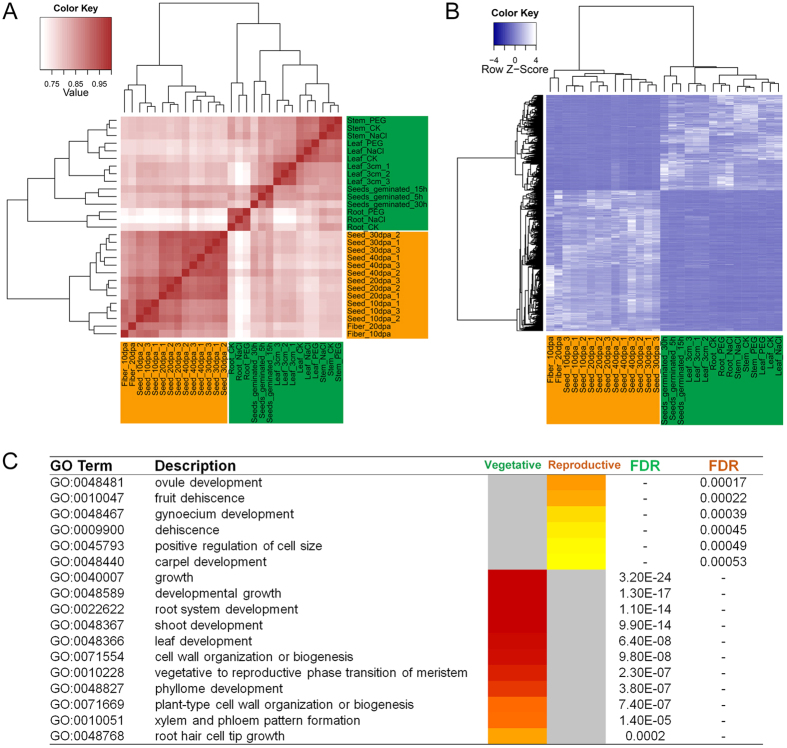
Figure 2. DEGs between vegetative (green) organs and reproductive (mature) organs.
(A) The heatmap describes the clustering results for the 29 RNA-seq samples. The heatmap classifies the 29 samples into two significant groups. One group includes seedling, root, leaf and stem tissues, while the other includes seed and fibre tissues. The tissues highlighted in green are considered vegetative organs, while tissues highlighted in orange are considered reproductive organs. (B) The gene expression profiling heatmap clusters 1752 DEGs into two groups, vegetative (green) and reproductive (orange). Genes are clustered vertically, and tissues are clustered horizontally. The DEGs of vegetative oranges are highly expressed (light blue or white) in the green-coloured tissues and lowly expressed (dark blue) in the orange-coloured tissues. The DEGs of reproductive oranges are highly expressed (light blue or white) in the orange-coloured tissues and lowly expressed (dark blue) in the green-coloured tissues. (C) Custom GO enrichment analyses of 1752 DEGs were performed by agriGO, maintaining a FDR < 0.05. The bars are coloured from dark red to light yellow from the most significantly enriched GO entry to the least significant GO entry, respectively. A grey-coloured bar indicates a GO entry without significant differences in vegetative or reproductive tissues. Tissue-specific GO entries are listed in this table; for example, genes highly expressed in vegetative organs (green) function in growth and development, while genes highly expressed in reproductive organs (mature) function in ovule, fruit and gynoecium development.

