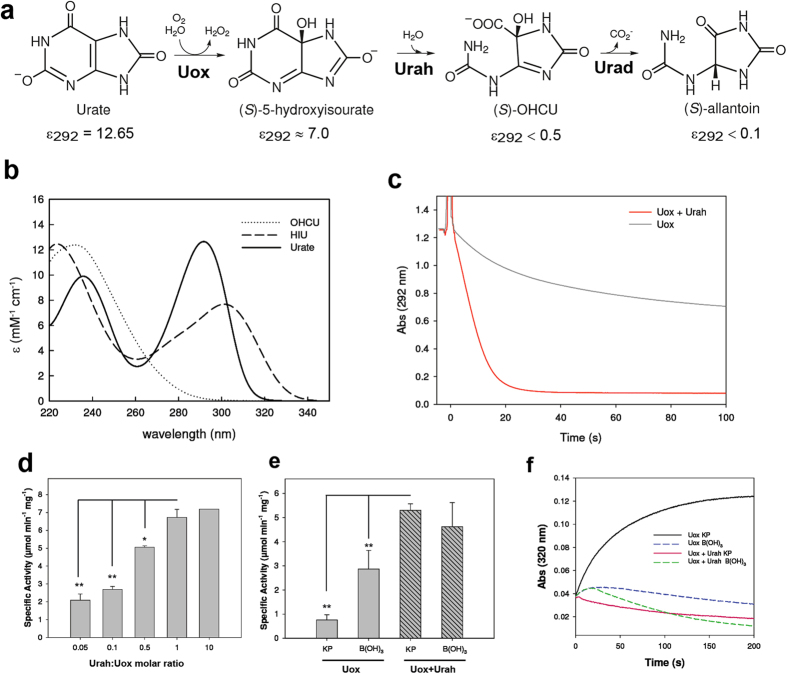
Figure 2. Enzymatic suppression of the spectrophotometric inference in the Uox reaction.
(a) Scheme of the enzymatic conversion of urate into allantoin; molar extinction coefficients (mM−1 cm−1) at 292 nm, pH 7.6, are indicated. (b) Experimental urate UV spectrum and calculated HIU and OHCU spectra in the region between 220 and 340 nm; approximate spectra were obtained by kinetic analysis56 of the time resolved spectra of the Uox reaction (supplementary Fig. S4). (c) Decrease of absorbance at 292 nm of 0.1 mM urate with the addition of DrUox (0.9 μM) in the absence (black curve) and in the presence (red curve) of equimolar DrUrah. (d) Uox activity as monitored by decrease of absorbance at 292 nm in the presence of different DrUrah:DrUox molar ratios. (e) Uox activity in potassium phosphate (KP) buffer (100 mM, pH 7.6) and Borate (B(OH)3) buffer (50 mM, pH 9.2) in the absence (filled bars) and in the presence (striped bars) of equimolar DrUrah. (f) Formation and decay of the HIU product of the Uox reaction monitored by absorbance at 320 nm in KP and B(OH)3 buffers in the absence and in the presence of equimolar DrUrah.

