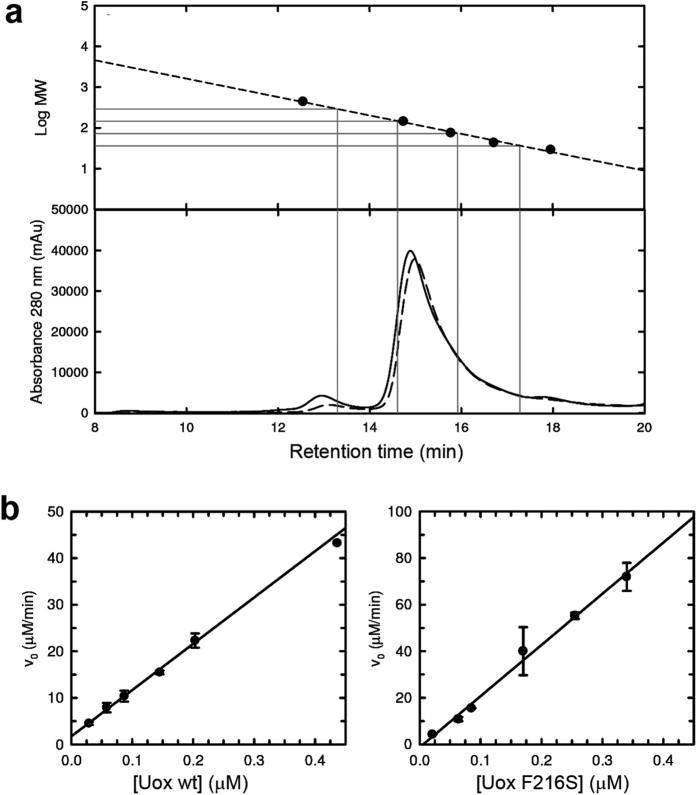
Figure 4. Quaternary states of DrUox and F216S mutant in solution.
(a) High-performance size-exclusion chromatography analysis of wt (solid line) and F216S (dashed line) DrUox; gray dropped lines represent the predicted retention times for the different oligomeric states (from left to right: octamer, tetramer, dimer, monomer). Calibration curve obtained from the separation of standard solutions of ferritin (440 kDa), GAPDH (144.2 kDa), conalbumin (75 kDa), ovalbumin (43 kD) and carbonic anidrase (29 kDa). (b) Activities of wild type (left panel) and mutant F216S (right panel) DrUox tested at increasing concentration of enzyme in the presence of 27 μM and 400 μM urate, respectively; reactions were carried out in the presence of equimolar DrUrah at 25 °C.

