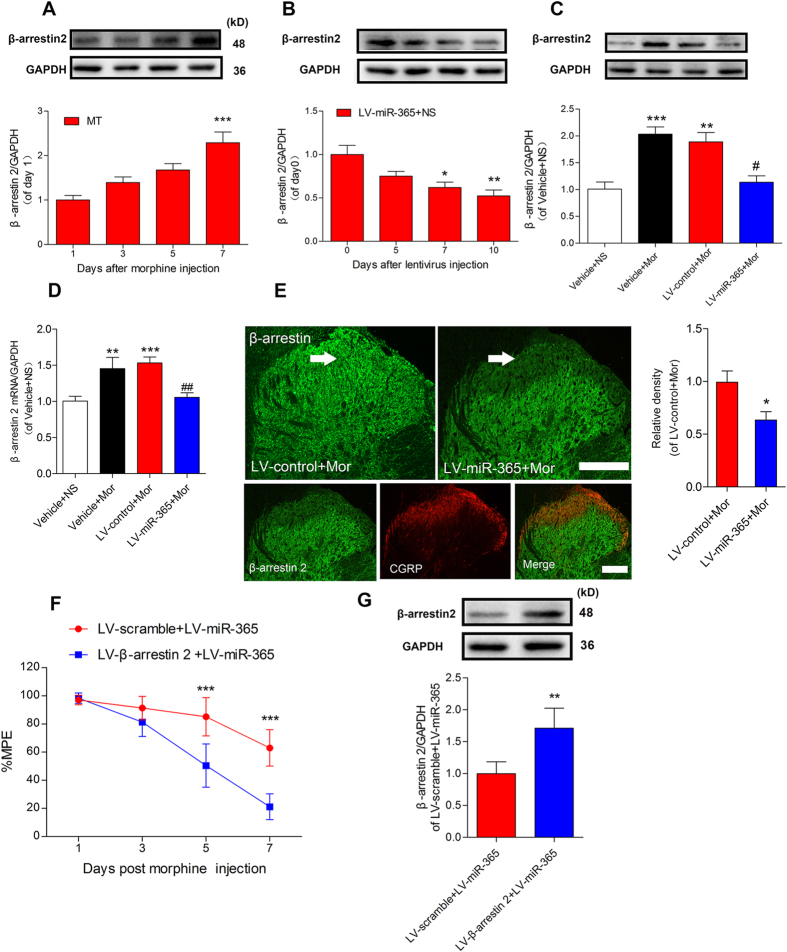
Figure 5. β-arrestin 2 is specifically downregulated in the spinal cord after overexpression of miR-365.
(A) Expression level of β-arrestin 2 in the L4 ~ 5 spinal cord during development of morphine tolerance. n = 5, ***P < 0.001 versus 1 day after morphine injection by one-way ANOVA followed by Bonferroni test. (B) Time course of β-arrestin 2 expression levels after viral transduction in the group of rats treated with LV-miR-365 + NS. n = 5, *P < 0.05, **P < 0.001 compared with 0 day just before lentivirus injection by one-way ANOVA followed by Bonferroni test. (C) Expression level of β-arrestin 2 protein in the spinal cord 10 days after induction with the lentiviral vector. n = 5, **P < 0.01, ***P < 0.001 compared with the Vehicle + NS, #P < 0.05, compared with LV-control + Mor group by one-way ANOVA followed by Bonferroni test. (D) Expression level of β-arrestin 2 mRNA in the L4 ~ 5 spinal cord 10 days after lentiviral vector induction. n = 6. **P < 0.01, ***P < 0.001, compared with the Vehicle + NS group, ##P < 0.01, compared with the LV-control + Mor group by one-way ANOVA followed by Bonferroni test. (E) Immunofluorescent staining for β-arrestin 2 in the dorsal horn of the spinal cord 10 days after miR-365 lentiviral vector injection. Immunofluorescent density of β-arrestin 2 (green) from the morphine treated group was downregulated (especially in the superficial lamina where CGRP is expressed) after injection of LV-miR-365. n = 4, *P < 0.05, compared with the LV-control + Mor group by Student’s t test. Scale bar = 200 μm. (F) Overexpression of β-arrestin 2 blocked miR-365 mediated attenuation of morphine tolerance. LV-β-arrestin 2 or LV-scramble was co-injected with LV-miR-365 3 days before chronic morphine injection. n = 5, ***P < 0.001 compared with the LV-β-arrestin 2 + LV-miR-365 group by two-way repeated-measures ANOVA followed by Bonferroni test. (G) Expression of β-arrestin 2 protein 10 days after co-injection of LV-β-arrestin 2 and LV-miR-365 in morphine treated rats. n = 4, **P < 0.01, compared with the LV-scramble + LV-miR-365 group by Student’s t test. All of the data are presented as mean ± s.e.m. miR = microRNA, NS = normal saline, Mor = morphine.

