Fig. 4.

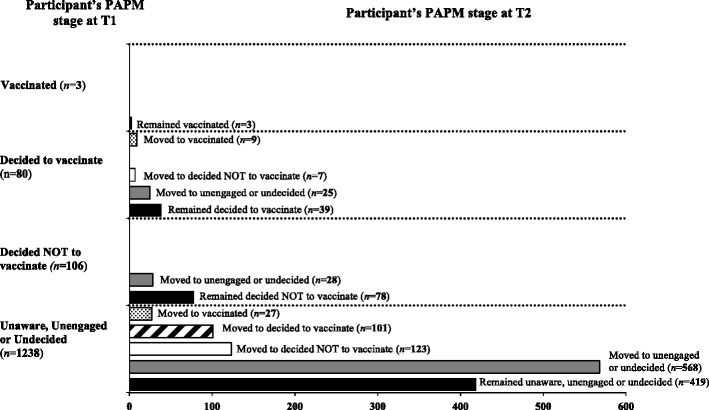
Number of participant’s initial PAPM stage reported at T1 is shown on the y-axis. Number of participant’s who remained in the same PAPM stage or their movement to a different PAPM stage at T2 shown on the x-axis (n =1427)

Number of participant’s initial PAPM stage reported at T1 is shown on the y-axis. Number of participant’s who remained in the same PAPM stage or their movement to a different PAPM stage at T2 shown on the x-axis (n =1427)