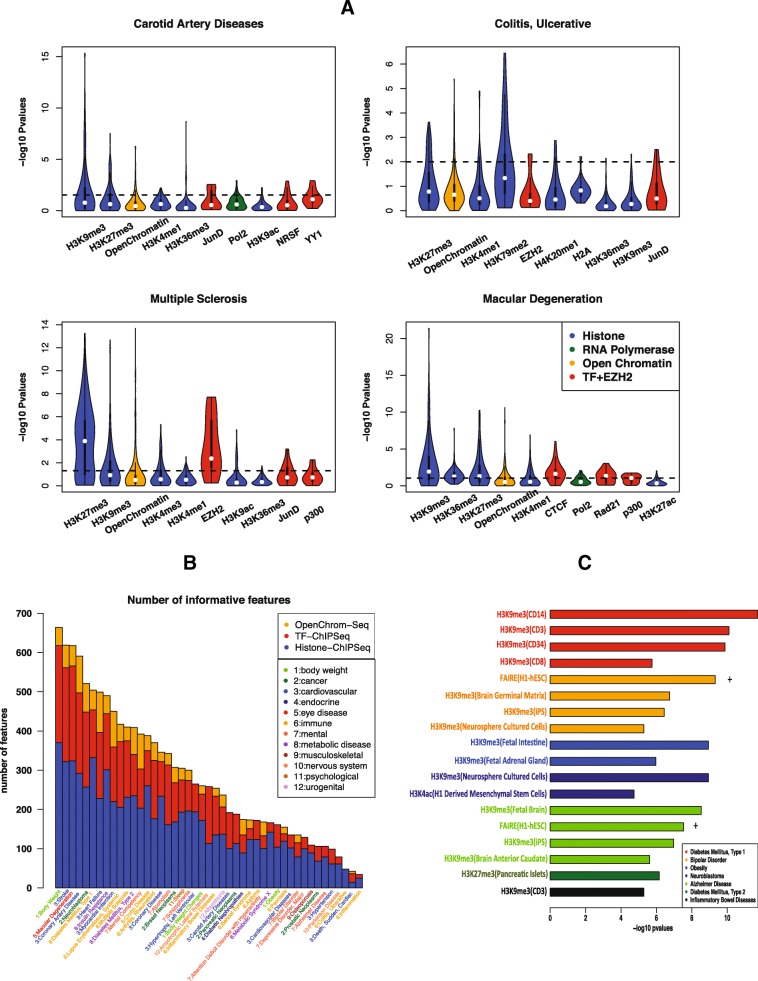
Fig. 6.
Exploration and interpretation of epigenomic features. a Violin plot for the distribution of –log10 p values of the top ten factors (TF binding, histone modification, open chromatin, RNA polymerase) associated with more than ten epigenomic features for four diseases: carotid artery disease, macular degeneration, ulcerative colitis, and multiple sclerosis. P values are calculated by t-test on the read counts in the neighborhoods of the risk variants and benign variants. b Number of informative features for three feature categories (TF binding, histone modification, open chromatin) for 45 diseases across 12 disease classes using read as the feature value. c Bar chart of –log10 p values for top-ranked features for selected diseases: type 1/type 2 diabetes, bipolar disorder, obesity, neuroblastoma, Alzheimer’s disease, and inflammatory bowel disease

