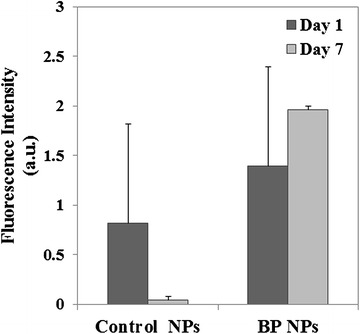
Fig. 4.

Targeting ability of Cy7-cojugated BP NPs compared to control NPs. Histogram of the difference in fluorescence between day 1 and day 7 of each NP. The fluorescence of the BP NPs remains constant indicating that they are retained in the area of the tumor, whereas the fluorescence of the control NPs is reduced, indicating that they have been cleared from the tumor area (analyzed by ImageJ software). Error bars represent standard deviation
