
Figure 1.
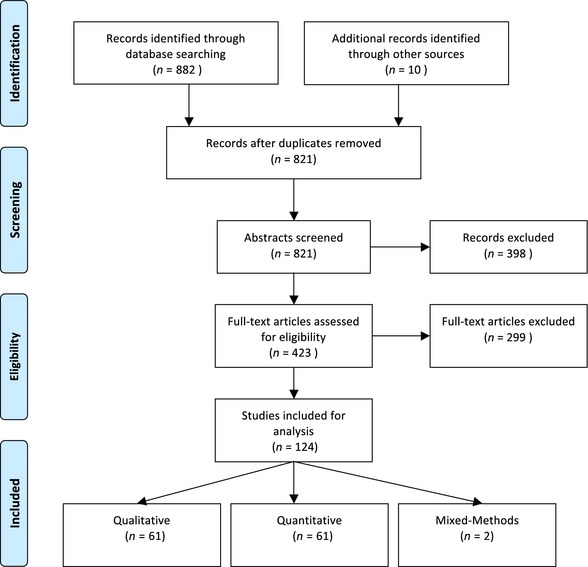
Flow diagram of study methodology. This flow diagram illustrates our study selection process, which culminated in a total count of 124 included studies. [Colour figure can be viewed at wileyonlinelibrary.com]
Official websites use .gov
A
.gov website belongs to an official
government organization in the United States.
Secure .gov websites use HTTPS
A lock (
) or https:// means you've safely
connected to the .gov website. Share sensitive
information only on official, secure websites.
Flow diagram of study methodology. This flow diagram illustrates our study selection process, which culminated in a total count of 124 included studies. [Colour figure can be viewed at wileyonlinelibrary.com]