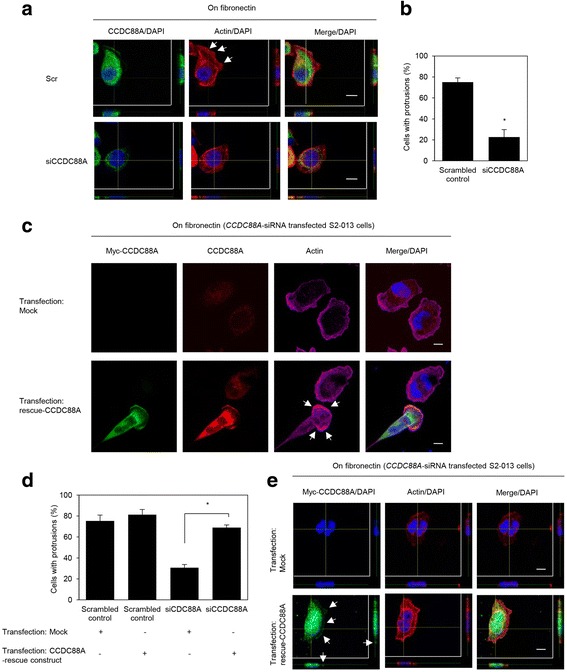
Fig. 5.

Roles of CCDC88A in the formation of cell protrusions. a. Confocal Z stack images of S2-013 cells that were transiently transfected with scrambled control-siRNA (Scr) or CCDC88A-siRNA (siCCDC88A). The transfected cells were incubated on fibronectin, and were subsequently stained with anti-CCDC88A antibody (green) and phalloidin (red). The lower and right panels in the confocal Z stack show a vertical cross-section (yellow lines) through the cells. Arrows, peripheral actin structures in cell protrusions of control-siRNA transfected cells. Blue, nuclear DAPI staining. Bars, 10 μm. b. Quantification of the data shown in Fig. 5a. Columns, mean; bars, SD. *p < 0.001 compared with Scr-transfected controls (Student’s t-test). c. Confocal immunofluorescence microscopic images of S2-013 cells that had been transfected with CCDC88A-siRNA and were subsequently transfected with a myc-tagged CCDC88A-rescue construct. After 48 h, the cells were incubated on fibronectin. Cells were stained with anti-myc antibody (green), anti-CCDC88A antibody (red) and phalloidin (violet). Arrows, cell protrusions reproduced by myc-tagged CCDC88A in CCDC88A-siRNA transfected cells. Blue, DAPI staining. Bars, 10 μm. d. Quantification of the data shown in Fig. 5c; the values represent the number of cells with fibronectin-mediated cell protrusions in which peripheral actin structures were increased. All cells in four fields per group were scored. Data are derived from three independent experiments. Columns, mean; bars, SD. *p < 0.001 compared with corresponding CCDC88A-siRNA transfected S2-013 cells that were transfected with mock vector (Student’s t-test) e. Confocal Z stack images showing nuclear DAPI staining (blue) and the accumulation of myc-tagged CCDC88A (green) in fibronectin-stimulated CCDC88A-siRNA transfected S2-013 cells transfected with the myc-tagged CCDC88A-rescue construct. Arrows, myc-tagged CCDC88A accumulated in cell protrusions. The lower and right panels of the confocal Z stack show a vertical cross-section (yellow lines) through the cells. Bar, 10 μm
