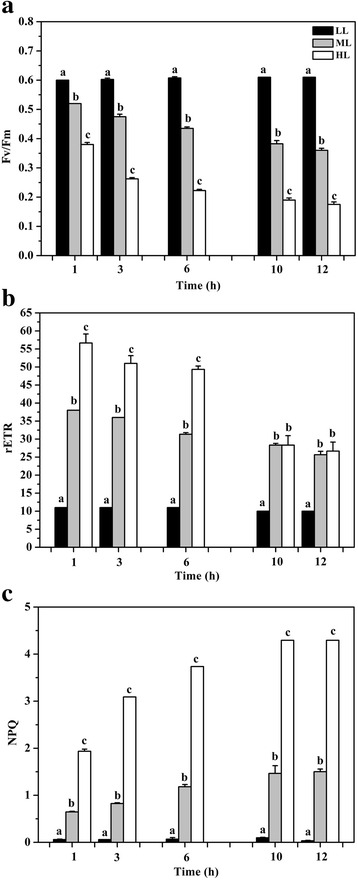
Fig. 1.

Time course of photosynthetic parameters after transition from low light (LL) to medium light (ML) or high light (HL). a Fv/Fm changes during 12 h of ML or HL treatment; b rETR changes during 12 h of ML or HL treatment; c NPQ changes during 12 h of ML or HL treatment. Different letters indicate significant differences between light regimes at P < 0.05. Error bars represent the standard deviations of the means generated from triplicates
