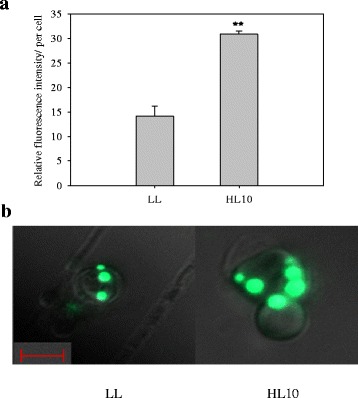
Fig. 5.

Accumulation of TAGs during 10 h of high light (HL) stress. a TAG content determined by Nile red staining; b confocal microscopy images of Nile red-stained cells subjected to HL treatment. * indicates significant differences (P <0.05) relative to low light (LL)-acclimated cells. The scale bar indicates 5 μm
