Fig. 1.

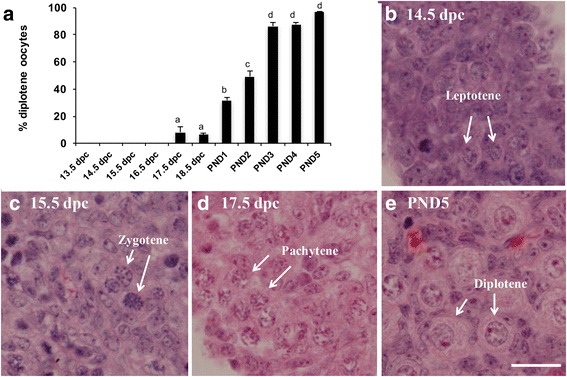
Diplotene stage oocytes are first detected at 17.5 dpc. a Percentage of oocytes at the diplotene stage of meiotic prophase I (± SEM) in perinatal mouse ovaries from 13.5 dpc to PND5. Different letters indicate a significant difference between groups (P < 0.05; n = 4–5 ovaries per time point) as determined by one-way ANOVA followed by Newman-Keuls multiple comparisons test. b-e Representative histological sections of perinatal mouse ovaries stained with hematoxylin and eosin showing different meiotic prophase I stages indicated by white arrows. b 14.5 dpc ovary showing oocytes at leptotene. c 15.5 dpc ovary showing oocytes at zygotene. d 17.5 dpc ovary showing oocytes at pachytene. e PND5 ovary showing oocytes at diplotene. Scale bar = 20 μM
