Fig. 4.

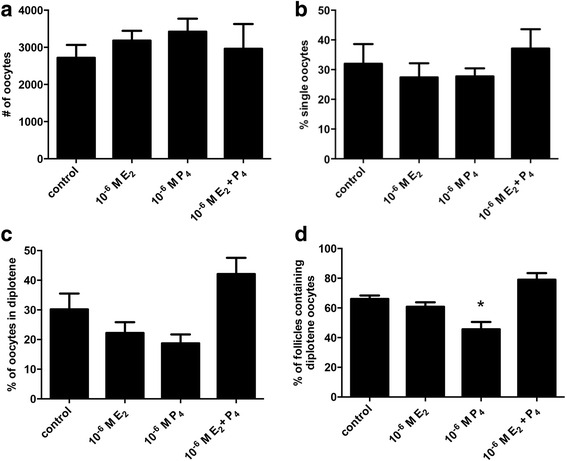
Effects of E2 and P4 treatment in organ culture on meiotic stage. a Total number of oocytes, b percent single oocytes c percent diplotene oocytes and d percent follicles containing diplotene stage oocytes per ovary in control ovaries or ovaries treated with 10−6 M E2, 10−6 M P4 or 10−6 M E2 + 10−6 M P4 for 4 days in organ culture. Data are presented as the mean ± SEM. * indicates a significant difference from control ovaries (P < 0.05; n = 5 ovaries per treatment) as determined by one-way ANOVA followed by Dunnett’s multiple comparisons test
