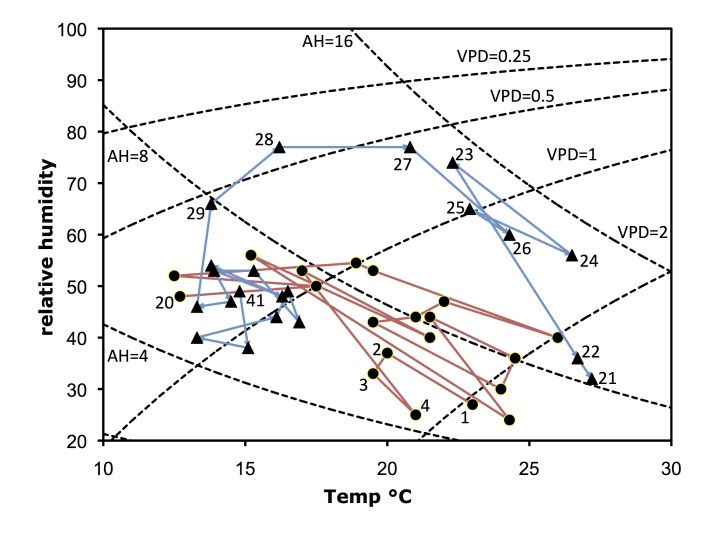
Figure 1.
Collecting conditions (temperature and relative humidity) at the sites (data plotted from Table 2). In this graph lines of constant absolute humidity (AH; g/m3) and vapour pressure deficit (VPD; kPa) are plotted as dashed lines. VPD is a measure of the drying power of the air. Circles (red line) mark collection localities 1-20 (April 2015) while the triangles (blue line) mark sites 21-41 (June 2015). Note that the environmental conditions during collection are very similar between Central Europe (sites 18-20) in April and Arctic Europe (sites 30-41) in June.

