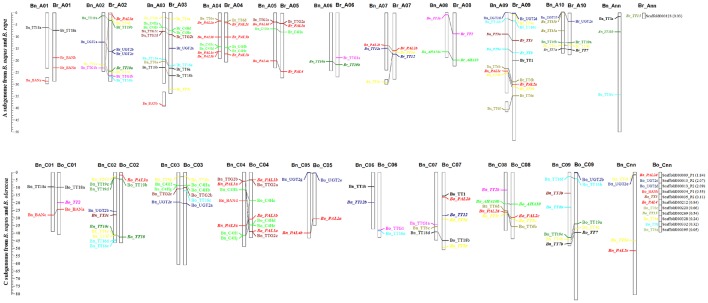
Figure 2.
Genomic distribution of the flavonoid biosynthesis pathway genes on B. rapa, B. oleracea, and B. napus chromosomes. The dissociation fraction of chromosomes indicates the normal single-copy locus mapped to the random chromosome; Ann and Cnn are the indeterminate Chromosome A and C. Numbers in parentheses are the physical distance of the scaffold for each gene. The collinearity of homologous genes were indicated by the ligatures among Brassica species. The homologous genes of flavonoid biosynthesis pathway were indicated by the same colors of the exact same fonts among different chromosomes of Brassica species.

