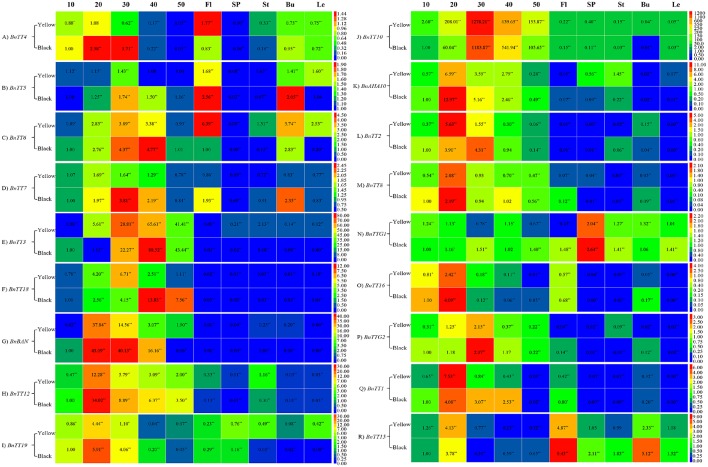
Figure 6.
Comparison expression analysis of genes involved in flavonoid biosynthesis in different tissues and organs between the yellow- and black-seeded B. napus. Three biological replicates for each sample were used for real-time PCR analysis and three technical replicates were analyzed for each biological replicate. Values represent the average ± SD of three biological replicates with three technical replicates of each tissue and organ. 10–50, Different stages of seed development; Fl, Flowers; SP, Silique pericarps; St, Stems; Bu, Buds; Le, Leaves. Red indicates high expression and blue indicates low expression. (A–R) were indicated the genes of BnTT4, BnTT5, BnTT6, BnTT7, BnTT3, BnTT18, BnBAN, BnTT12, BnTT19, BnTT10, BnAHA10, BnTT2, BnTT8, BnTTG1, BnTT16, BnTTG2, BnTT1, and BnTT15, respectively.

