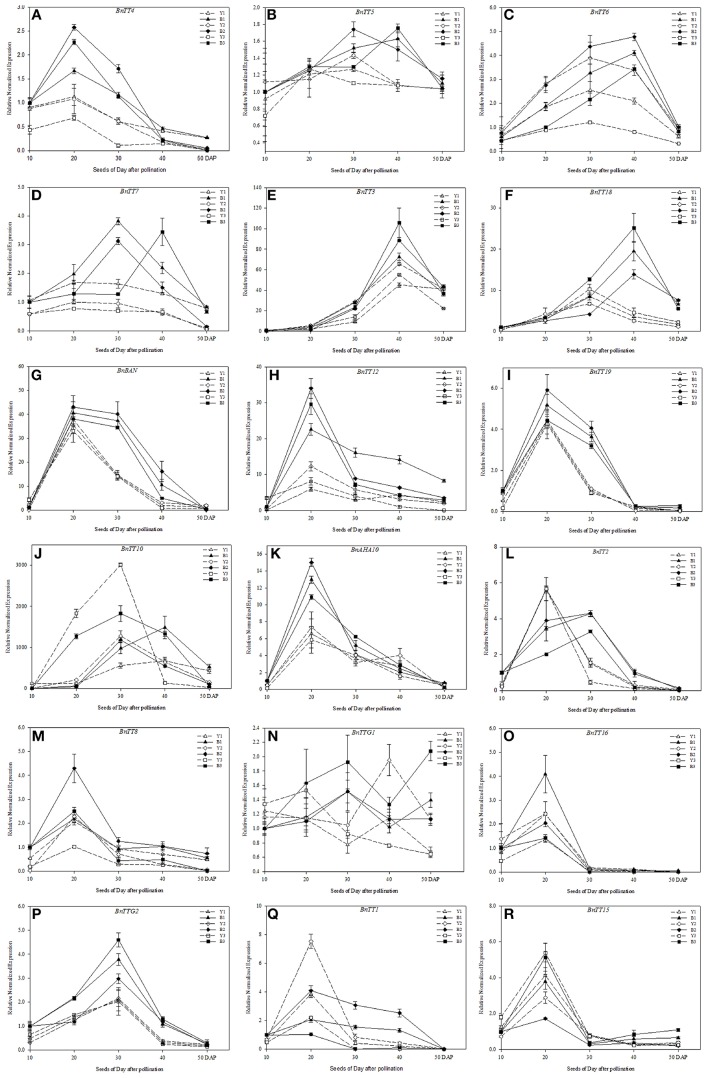
Figure 7.
Expression pattern analysis of genes involved in flavonoid biosynthesis in the developing seeds of different B. napus lines by qRT-PCR. The yellow-seeded lines include Y1, Y2, and Y3, and the black-seeded lines include B1, B2, and B3 (A–R). Expression was monitored at five stages of seed development (10, 20, 30, 40, and 50 DAP). Values represent the average ± SD of three biological replicates with three technical replicates of each developmental stage. Error bars denote standard error of the mean (SEM) of three experiments. Relative gene expression levels were normalized according to the expression values in black-seeded B. napus at 10 DAP.

