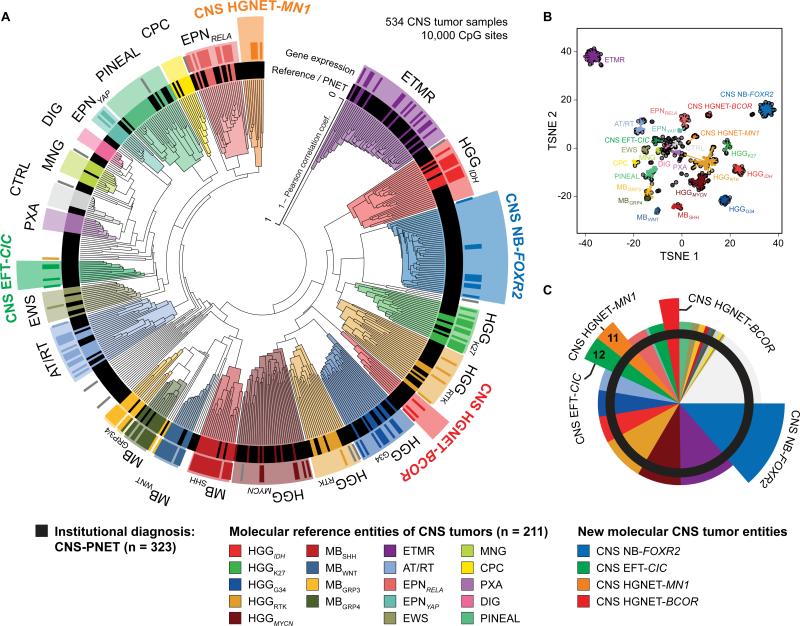
Figure 1. Molecular Classification of CNS-PNETs by DNA Methylation Profiling.
(A) Unsupervised clustering of DNA methylation patterns of 323 CNS-PNET samples alongside 211 reference samples representing CNS tumors of known histology and molecular subtype using the 10,000 most variably methylated probes. Molecular diagnostic reference tumors or CNS-PNETs (inner circle) and gene expression subgroup assignment (outer circle) are depicted by colored bars as indicated. DNA methylation clusters are highlighted by colors as indicated. Grey bars indicate samples unclassifiable by gene expression analyses.
(B) Two dimensional representation of pairwise sample correlations using the 10,000 most variably methylated probes by t-Distributed Stochastic Neighbor Embedding (tSNE) dimensionality reduction. The same samples as in (A) are used (n = 534). Reference samples are colored according to their molecular reference entity. CNS-PNET samples are colored in black. Lines connect each sample to the centroid of its respective molecular CNS tumor entity.
(C) Re-classification of 323 CNS-PNETs into known molecular reference entities and four new CNS tumor entities by molecular profiling. Entities correspond to DNA methylation clusters and are represented by colors as indicated.

