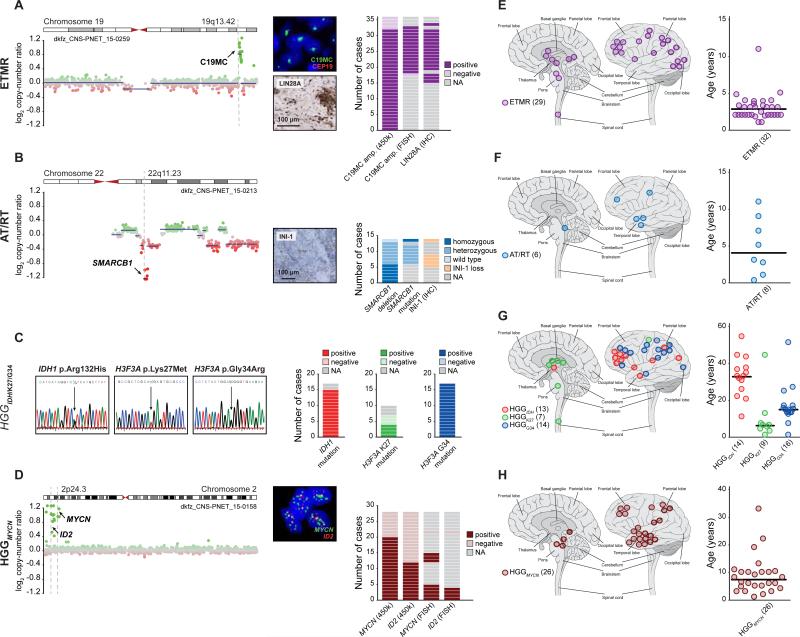
Figure 2. Molecular and Clinical Characteristics of Re-Classified CNS-PNET Groups.
(A-D) Molecular characteristics of CNS-PNETs from ETMR (A), AT/RT (B), HGGIDH, HGGK27, and HGGG34 (C), and HGGMYCN (D) DNA methylation clusters. Detection and frequency of characteristic molecular alterations in each group are indicated. Representative copy-number profiles in (A), (B), and (D) depict genomic gains (green dots) and losses (red dots) on individual chromosomes as indicated. FISH and IHC images in (A), (B), and (D) show representative tumor samples.
(E-H) Tumor location and age at diagnosis from ETMR (E), AT/RT (F), HGGIDH, HGGK27, and HGGG34 (G), and HGGMYCN (H) DNA methylation clusters. Black bars in age plots indicate the median. Numbers in brackets indicate group size with available data.

