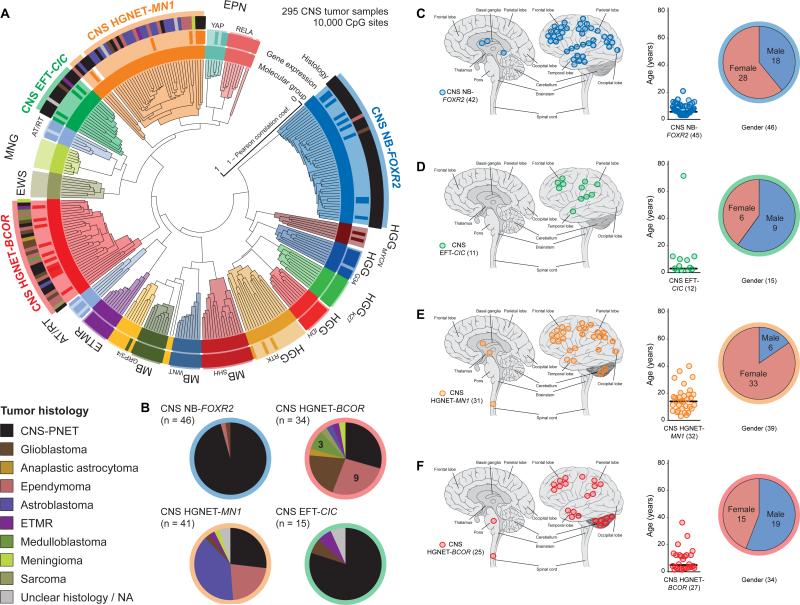
Figure 3. Identification of New CNS Tumor Entities Across Histologies.
(A) Unsupervised clustering of DNA methylation patterns of 77 CNS-PNET samples alongside 159 reference samples and 59 additional samples representing CNS tumors of varying histology using the 10,000 most variably methylated probes. Molecular subgroup assignment by DNA methylation (inner circle) or gene expression patterns (middle circle) correspond to subgroup labels. Original tumor histology (outer circle) is depicted for tumors from new molecular CNS tumor entities by colored bars as indicated.
(B) Composition of four new CNS tumor entities by histological diagnosis. Tumor histology is represented by colors as indicated.
(C-F) Clinical patient information for four novel CNS tumor entities CNS NB-FOXR2 (C), CNS EFT-CIC (D), CNS HGNET-MN1 (E), and CNS HGNET-BCOR (F). For each entity, tumor location (left panel), age at diagnosis (middle panel), and gender distribution (right panel) are shown. Numbers in brackets indicate group size with available data.

