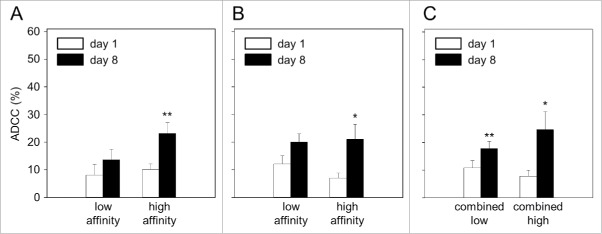
Figure 3.
Impact of FCGR2A and -3A genotypes on antibody-dependent cell-mediated cytotoxicity (ADCC). Patient blood samples were collected prior to start (baseline; day 1; white column) and on day 8 of long-term infusion of ch14.18/CHO (day 8; black column). ADCC was analyzed with Calcein-AM-based cytotoxicity assay using GD2-positive neuroblastoma cell line LA-N-1, patient-specific leukocytes and heat inactivated serum.27 ADCC in patients with low- (n = 15) and high-affinity (n = 38) polymorphisms of FCGR2A (8.05 ± 4% vs. 13.68 ± 4% and 10.12 ± 2% vs. 23.20 ± 4%, respectively) (A) and (B) FCGR3A low- (n = 26) and high-affinity polymorphisms (n = 27) (12.08 ± 3% vs. 20.08 ± 3% and 7.01 ± 2% vs. 21.03 ± 5%, respectively). (C) ADCC levels in patients with combined FCGR2A and -3A low (n = 33) and high affinity (n = 20) genotype (10.86 ± 3% vs. 17.80 ± 3% and 7.74 ± 2% vs.24.65 ± 6%, respectively). Data are shown as mean values ± SEM of experiments performed in triplicate. (A) Wilcoxon signed-rank test; **p = 0.084 and 0.002 vs. low- and high-affinity baseline, respectively. (B) Wilcoxon signed-rank test; *p = 0.011 and 0.023 vs. low- and high-affinity baseline, respectively. (C) Paired t-test; **p = 0.006 vs. low-affinity baseline. Wilcoxon signed-rank test; *p = 0.043 vs. high-affinity baseline.

