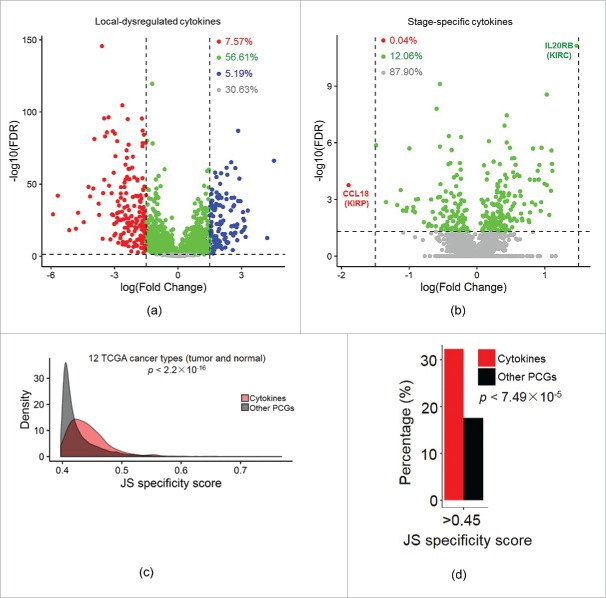
Figure 4.
Potential of cytokines as specific biomarker in human cancers. (A) Volcano plot of local-dysregulated cytokines. Each dot represents one cytokine in a given tumor type. Cytokines with a false discovery rate (FDR) of <0.05 and log-multiple of change of >1.5 are colored red (downregulated) and blue (upregulated), respectively. (B) Volcano plot of stage-specific cytokines. (C) Distributions of maximal normal-tumor specificity scores calculated for each gene across TCGA cancer types for cytokines and other protein-coding genes (PCGs). (D) Bar plots depicting differences between percentages of genes with specificity scores of >0.45 for cytokines and other PCGs.

