Figure 1.

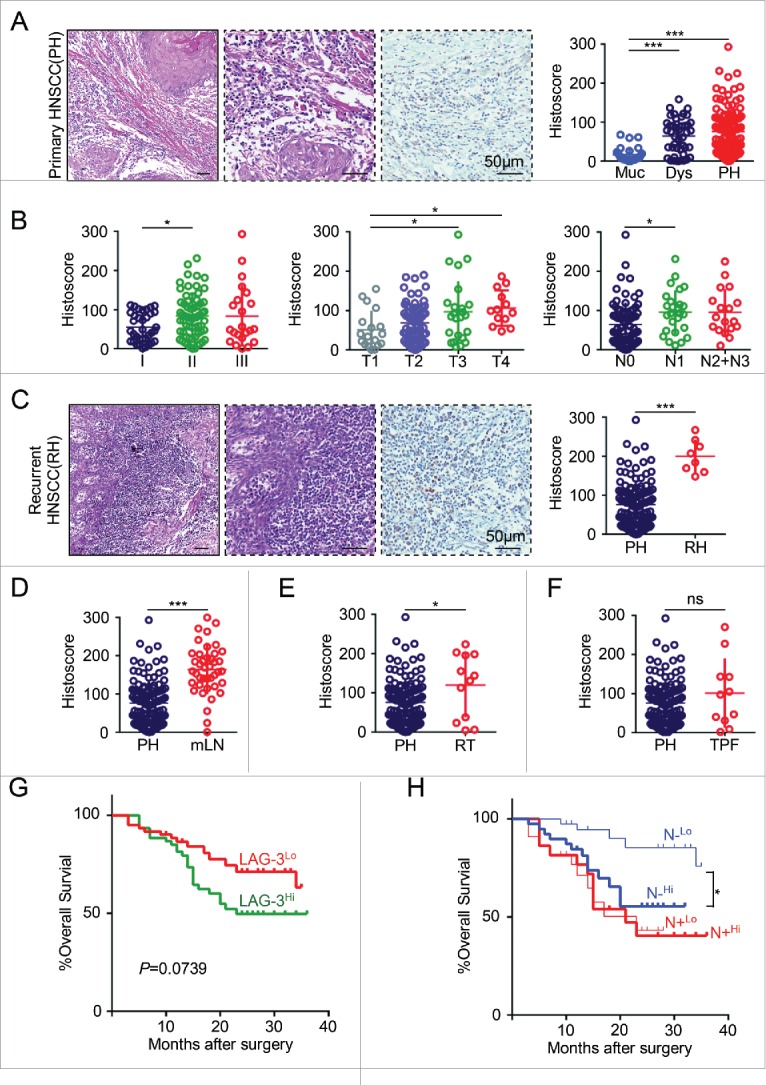
LAG-3 is highly expressed on tumor-infiltrating lymphocytes and correlated with clinicopathological parameters in human HNSCC. (A) Hematoxylin and Eosin (HE) staining and LAG-3 immunostaining of human primary HNSCC (PH) (left panel). Scale bar, 50 μm. The histoscore of LAG-3 expression in normal mucosa (Muc, n = 27), dysplasia (Dys, n = 43) and PH (n = 122) are quantified (right panel). Data were presented as Mean ± SEM, One-way ANOVA with post Tukey test, ***p < 0.001. (B) The quantitative analysis of LAG-3 histoscore is performed in pathological grades (I–III, left panel), tumor size (T1, T2, T3, T4, middle panel) and lymph node status (negative, N0; positive, N1, N2+N3, right panel), One-way ANOVA with post Tukey test, *p < 0.05. (C) Representative images of HE and LAG-3 immunostaining in recurrent HNSCC (RH, left panel). Scale bar, 50μm.The quantitative analysis of LAG-3 histoscore in PH and RH (right panel). Unpaired t test, ***p < 0.001. The quantitative analysis of LAG-3 histoscore is performed in (D) metastatic lymph nodes (mLN vs. PH), (E) HNSCC with pre-radiotherapy history (RT vs. PH), or (F) HNSCC with inductive TPF chemotherapy (TPF vs. PH). Data is analyzed by unpaired t test, *p < 0.05, ***p < 0.001, ns, no significance. p value and the number of each group or subgroup were displayed in Table S1. (G) Kaplan–Meier survival analysis and Log-rank test displayed overall survival (OS) of PH patients with high LAG-3 expression (LAG-3Hi) vs. low LAG-3 expression (LAG-3Lo). p (LAG-3Hi vs. LAG-3Lo) = 0.0739. (H) Prognostic role of LAG-3 expression level (High vs. Low) in PH with negative lymph node status (N−) and positive lymph node status (N+). P (N−Hi vs. N−Lo) = 0.0108; p (N+Hi vs. N+Lo) = 0.9229. All p value, Hazard ratio and 95% confidence interval were displayed in Table S2. For the variation of LAG-3 expression in different groups, all PH or PH subgroups were evenly categorized as LAG-3 high group and LAG-3 low group by the level of LAG-3 expression.
