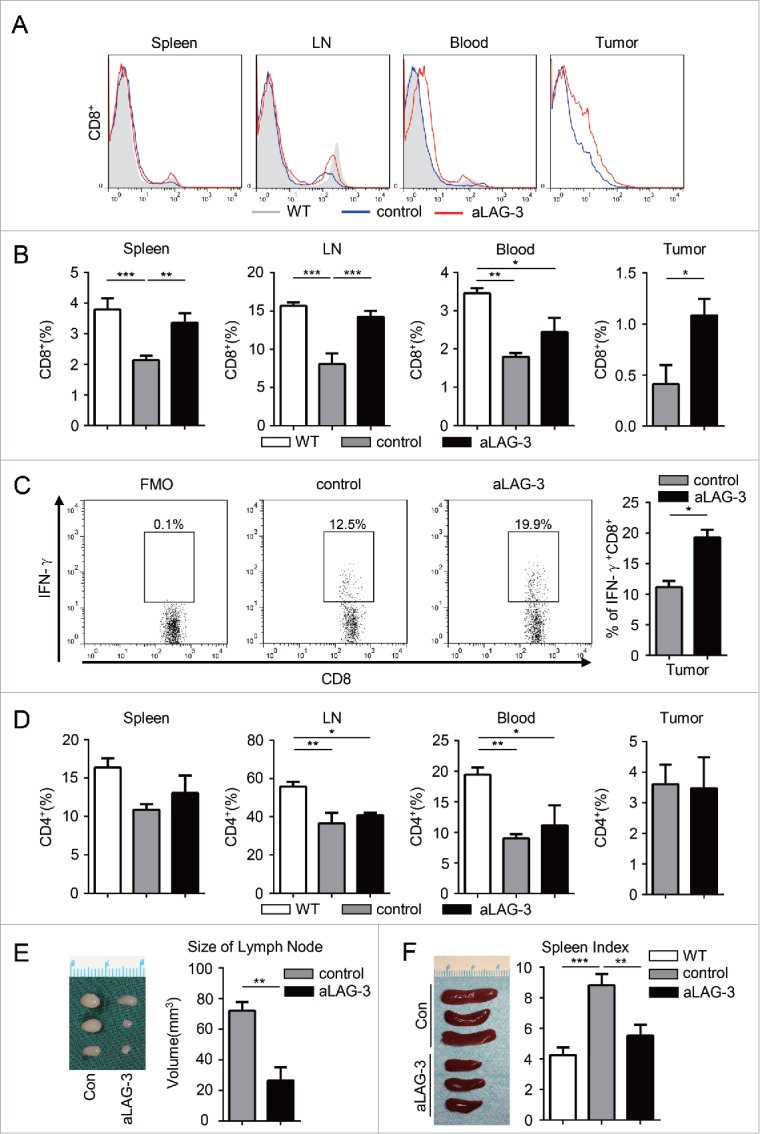
Figure 5.

The blockade of LAG-3 (aLAG-3) enhanced the antitumor response of CD8+ T cells in HNSCC mouse model. (A) Histogram and (B) quantification of CD8+ T cells population in WT mice, control mice and aLAG-3 mice. Cells were harvested from spleen, lymph node (LN), peripheral blood and tumor tissues. The percentage of CD8+ T cells is the proportion of CD8+ T cells accounting for the number of the total viable cells. Data are shown as Mean ± SEM. *p < 0.05, **p < 0.01, ***p < 0.001. (C) Representative flow cytometric plots and the percentage of IFNγ+CD8+ T cells population in tumor-infiltrating lymphocytes (TILs) from control group and aLAG-3 group. Data presented as Mean ± SEM. *p < 0.05. (D) Quantitative analysis of the percentage of CD4+ T cells in WT group, control group and aLAG-3 group. Cells were harvested from spleen, LN, peripheral blood and tumor tissues. The percentage of CD4+ T cells is the proportion of CD4+ T cells accounting for the number of the total viable cells. Data presented as Mean ± SEM. *p < 0.05, **p < 0.01. (E) The variation of lymph nodes observed in control group and aLAG-3 group (left panel) and the size of lymph node was measured as indicated (right panel). Data presented as Mean ± SEM. **p < 0.01. (F) Spleens were harvested for photograph from control group and aLAG-3 group (left panel). The spleen index was calculated as indicated (right panel). Data are presented as Mean ± SEM. **p < 0.01, ***p < 0.001.
