
Figure 1.
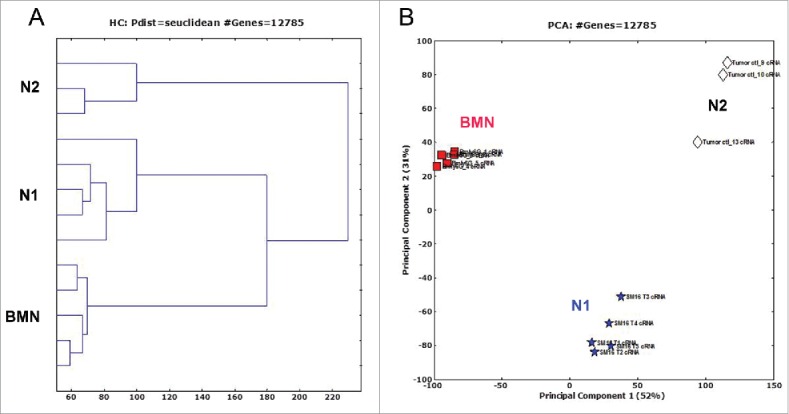
Hierarchical clustering (A) and principal component analysis (PCA) (B) of bone marrow naive neutrophils (BMN, □), tumor-associated neutrophils (N2 TANs, ⋄) and TANs following treatment with SM16 (N1 TANs, ☆), showing that the three neutrophils subpopulations display distinct transcriptomic profiles.