
Figure 3.
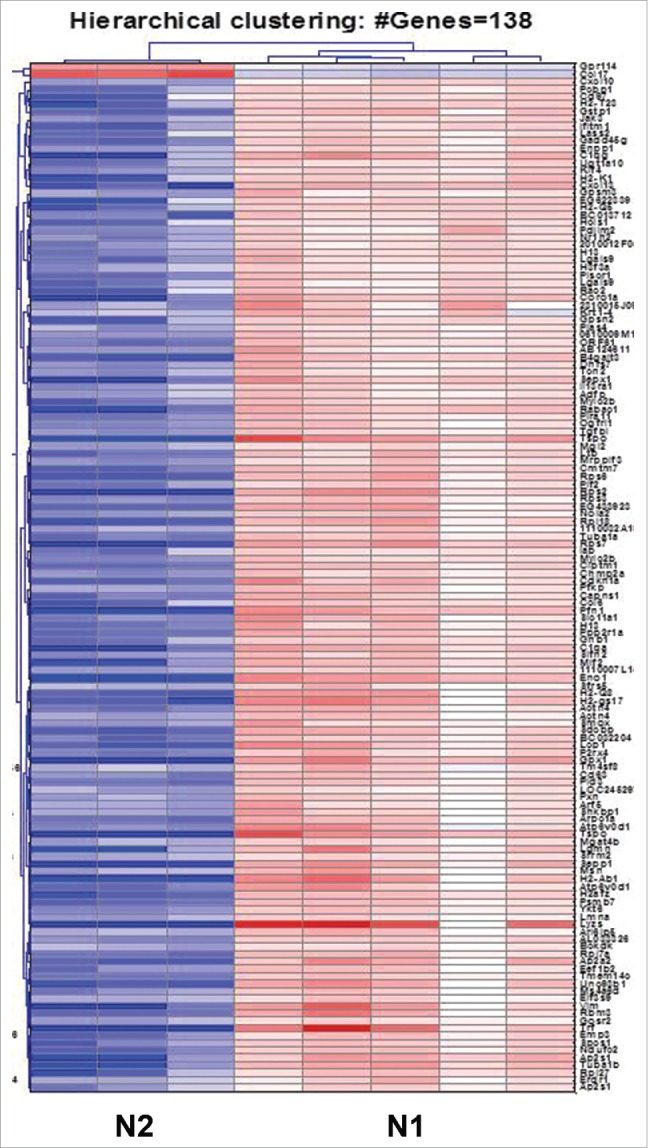
Heatmap of the 138 genes showing strongest alteration, with fold change higher than 10, between the N1 and N2 groups of neutrophils. The N1 TANs exhibit a markedly different signature compared to N2, with 136 genes upregulated and 2 genes downregulated with a fold change ≥ 10. (Red – upregulation; blue – downregulation; white – no change from mean). The list of genes is given in Table S1.