
Figure 5.
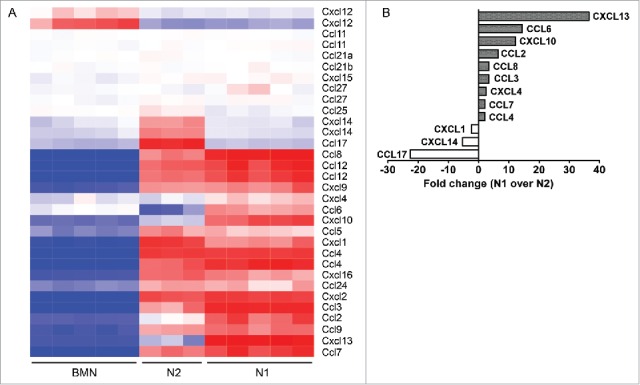
(A) Heatmap comparing the expression of 26 chemokines in the three groups of neutrophils – bone marrow naive neutrophils (BMN), tumor-associated neutrophils (N2 TANs), and following SM16 treatment (N1). Red – upregulation; blue – downregulation; white – no change from mean. (B) Summary of the chemokines most highly altered in N1 vs. N2, with a fold change higher than 2.