
Figure 6.
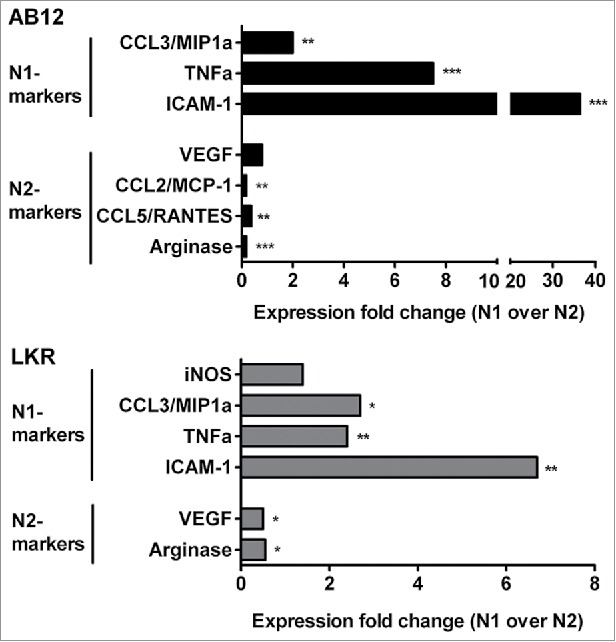
Gene expression for N1 and N2 markers in N1 TANs (following SM16 treatment) compared to N2 (N2 expression level =1). Selected results from the microchip array were confirmed using real-time RT-PCR in isolated tumor-associated neutrophils (TAN) from flank tumors of two separate tumor cell lines – the mesothelioma cell line AB12, and the non-small cell lung cancer LKR cell line. *p < 0.05; **p < 0.01; ***p < 0.001.