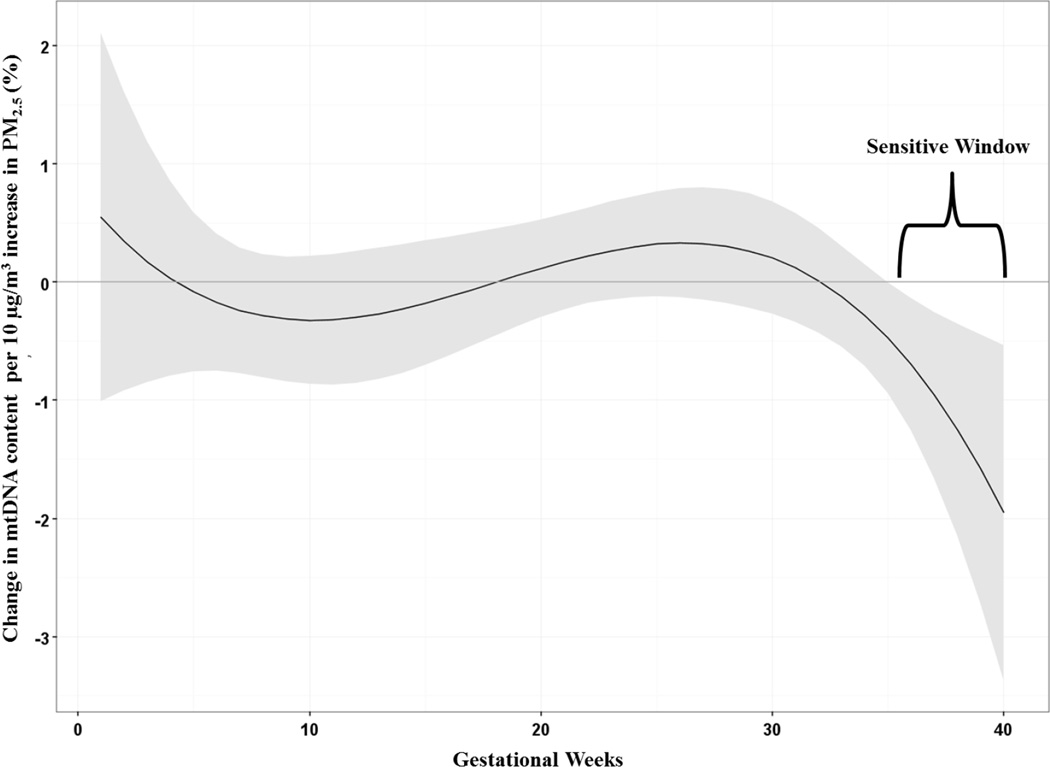
Figure 1.
Associations between weekly prenatal PM2.5 and mtDNA content in cord blood in the entire sample (n=456). Adjusted for sex, maternal age at delivery, year of birth, maternal education, prenatal exposure to environmental tobacco smoke and batch. The y-axis represents the change in mtDNA content associated with a 10 µg/m3 increase in PM2.5; the x-axis is gestational age in weeks. Solid lines show the predicted change in mtDNA content. Gray areas indicate 95% CIs. A sensitive window is identified for the weeks where the estimated pointwise 95% CI (shaded area) does not include zero.

